Gantt Chart for a Research Proposal: Example and Template
By Dr. Ahmed Mortuza Saleque · Updated · How we check our content
The short answer
A research proposal Gantt chart lists your work packages and tasks down the left, time across the top in months or quarters, and a bar for when each task runs. Add milestones and deliverables as markers, show who leads each task, and make sure every objective in the proposal has at least one bar. For a 3-year grant, quarters (Y1 Q1 to Y3 Q4) are usually enough.
Open the Gantt Chart Maker →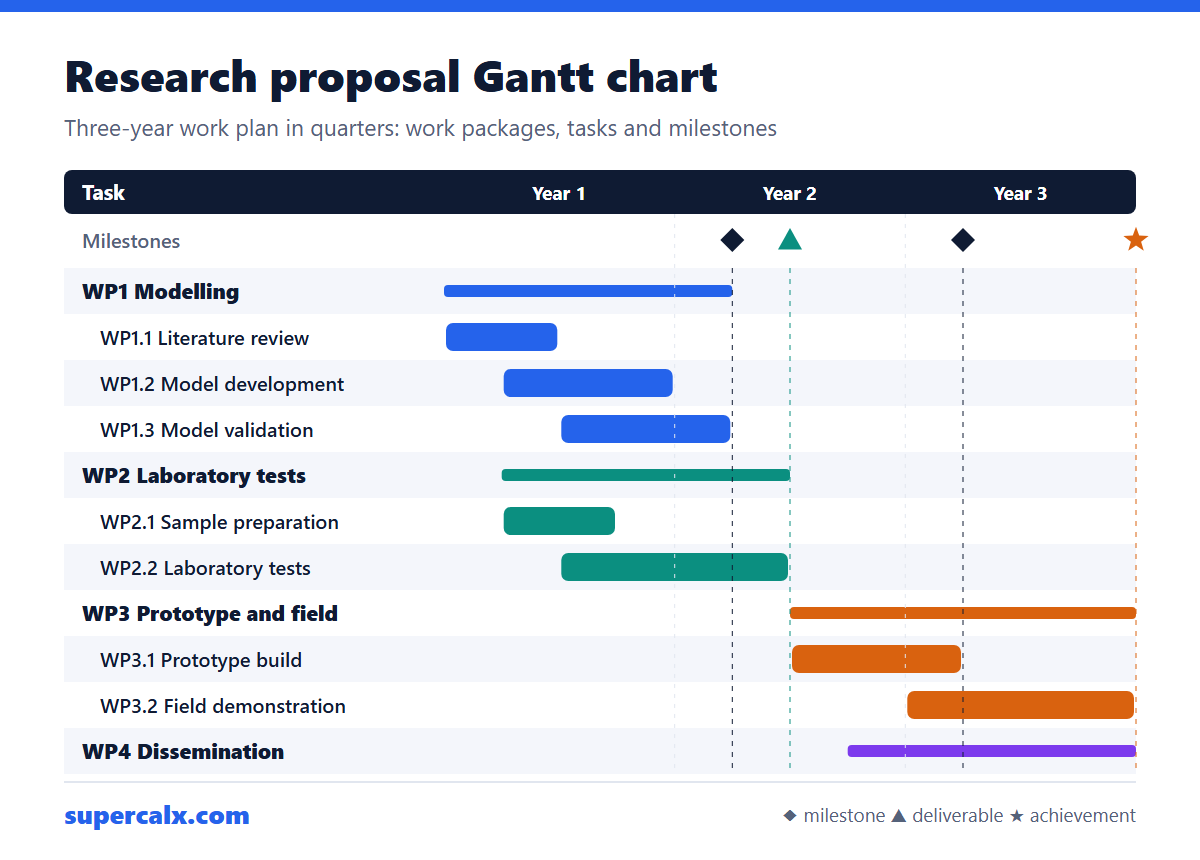
What reviewers look for in the work plan
- Every objective in the proposal maps to a work package (WP), and every WP has tasks with start and end times.
- The order makes sense: data collection starts after ethics approval, analysis overlaps the end of data collection, writing overlaps analysis.
- Milestones are checkable events (model validated, prototype built), not activities.
- Deliverables are things you hand over (a report, a dataset, a paper), each with a due date.
- Each task has a named lead, so the panel can see the team is not overloaded.
- The last quarter is not crammed. Leave time for the final report and dissemination.
Example: a 3-year project in four work packages
Quarter-level plan. Y1 Q1 means the first three months of the grant, not January.
| Code | Task | Lead | When |
|---|---|---|---|
| WP1.1 | Literature review and data collection | PI | Y1 Q1–Q2 |
| WP1.2 | Model development | PI | Y1 Q2–Q4 |
| WP1.3 | Model validation | Postdoc | Y1 Q3 – Y2 Q1 |
| WP2.1 | Sample preparation | Co-I | Y1 Q2–Q3 |
| WP2.2 | Laboratory tests | Co-I | Y1 Q3 – Y2 Q2 |
| WP3.1 | Prototype build | Engineer | Y2 Q3 – Y3 Q1 |
| WP3.2 | Field demonstration | Co-I | Y3 Q1–Q4 |
| WP4.1 | Publications, workshop and final report | PI | Y2 Q4 – Y3 Q4 |
Milestones for this plan: validated model (Y2 Q1), prototype ready (Y3 Q1) and field demonstration complete (Y3 Q4). A deliverable such as the lab results report (Y2 Q2) sits at the end of WP2.2.
Build it in five minutes
- Open the Gantt Chart Maker and choose Paste your plan. It is free and needs no sign-up.
- Type or paste one task per line as code | name | lead | time, for example: WP1.1 Literature review | PI | Y1 Q1-Q2. Columns copied from a Word or Excel table also work.
- Start each work package with a line that has no time, such as WP1 Modelling. That line becomes the group heading.
- Add markers on their own lines: Milestone: Validated model | Y2 Q1 or Deliverable: Lab report | Y2 Q2 | on WP2.2.
- Pick the Research proposal style, drag bars to adjust, then download a PNG at print quality or an SVG for the proposal document.
The tool keeps everything in your browser. Copy link encodes the whole plan in the URL, so co-applicants can open the same chart without an account.
Months, quarters or real dates?
| Project length | Best columns | Why |
|---|---|---|
| Under 12 months | Months (M1–M12) | Quarters hide too much detail |
| 1 to 3 years | Quarters (Y1 Q1) | Fits on one A4 landscape page |
| 4 years or more | Quarters or half-years | Months make the chart too wide |
| Fixed start date known | Calendar months | Lets you show a today line later |
Most funders prefer relative time (Month 1, Year 1) because the start date often moves after the award. To count months between two real dates, use the date calculator.
Common mistakes
- Every bar running the full length of the project. It tells the reviewer nothing.
- Milestones written as tasks ("Testing") rather than outcomes ("Test campaign complete").
- A plan that does not match the budget. If the postdoc starts in Month 6, salary costs should too; estimate effort with the man-hours calculator.
- Text too small to read once the chart is shrunk to fit the page. Export at 3× and check it on paper.
Common questions
Does a research proposal need a Gantt chart?
Many funders ask for a work plan or timeline, and a Gantt chart is the most common way to show it. Check the call text: some want a table, some a chart, some both.
How detailed should a proposal Gantt chart be?
Work packages and their main tasks, usually 10 to 25 bars, plus 3 to 8 milestones. Detailed weekly tasks belong in your own project plan, not the proposal.
What is the difference between a milestone and a deliverable?
A milestone is a checkpoint that marks progress, such as a validated model. A deliverable is an output you hand over, such as a report or dataset.
Can I make a research Gantt chart without Excel?
Yes. The free Gantt Chart Maker on SuperCalX builds it from pasted text and exports PNG, SVG, PDF or CSV.
Calculators for this article
More from the blog
 PhD and Thesis Gantt Chart: Timeline Example by Month
 Gantt Chart Milestones and Deliverables: How to Show Them
 Gantt Chart vs PERT Chart vs Timeline: Which to Use
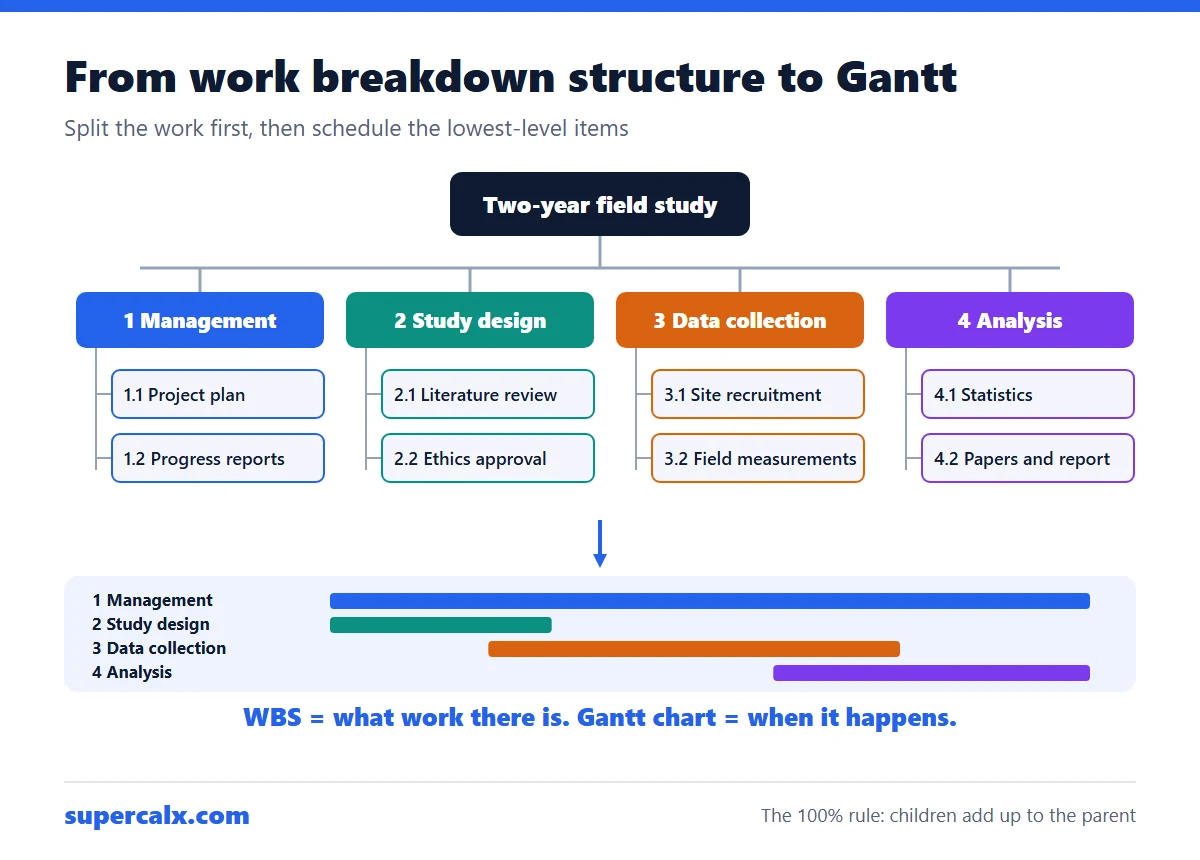 Work Breakdown Structure Example: From WBS to Gantt Chart
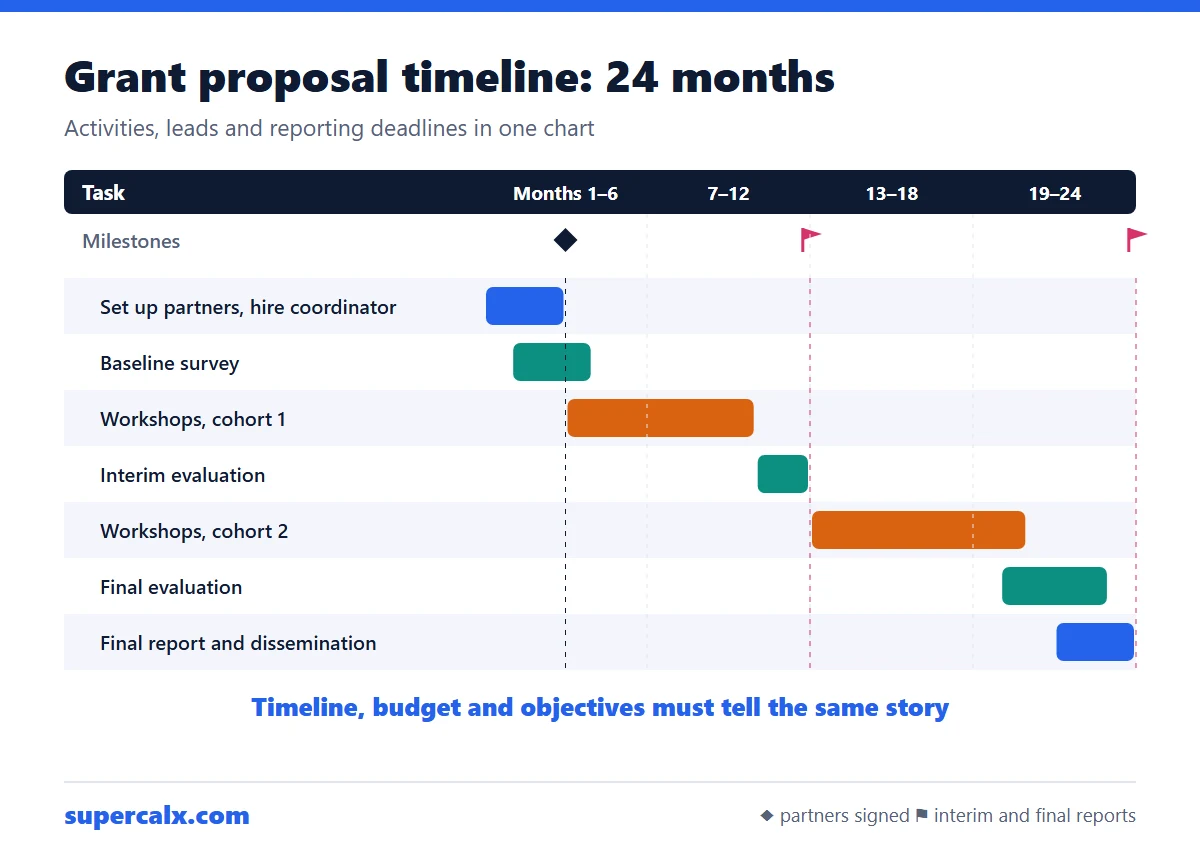 How to Write a Grant Proposal Timeline (With Example)
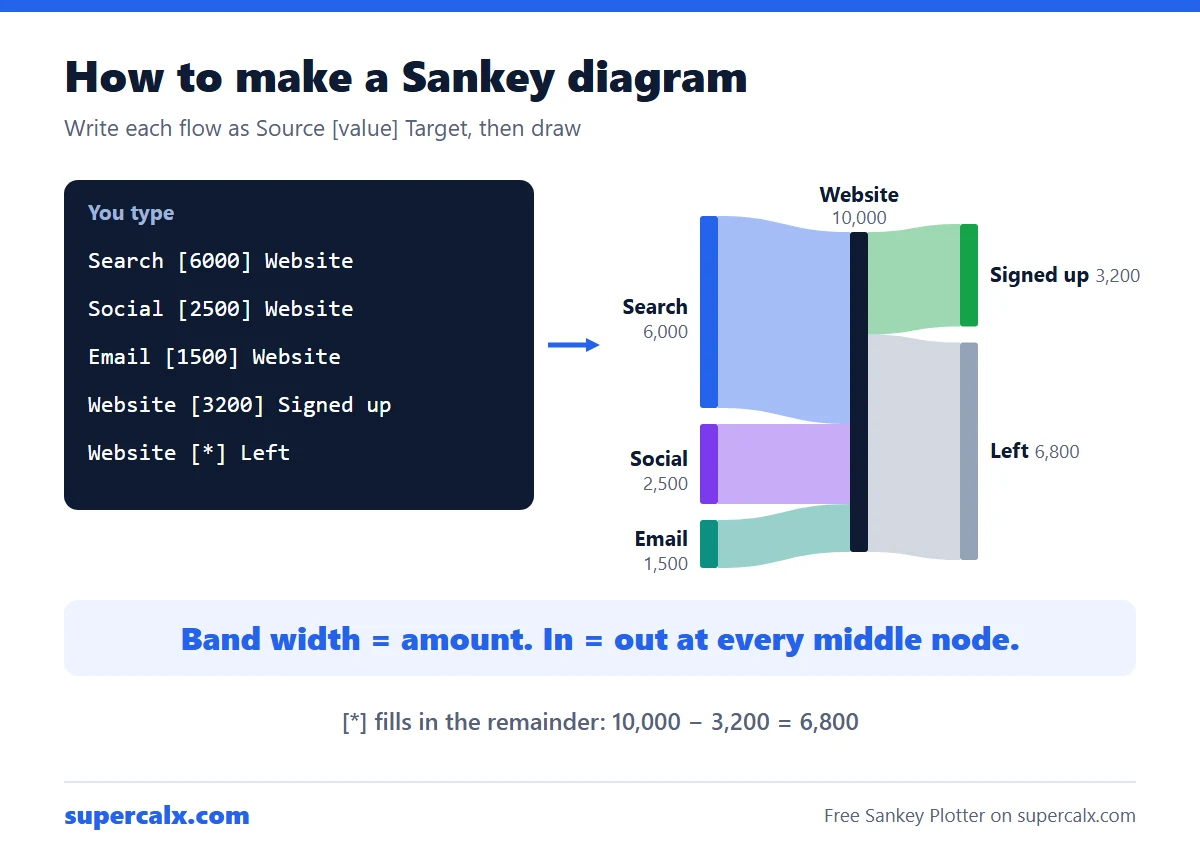 How to Make a Sankey Diagram (Free, No Excel Add-in)
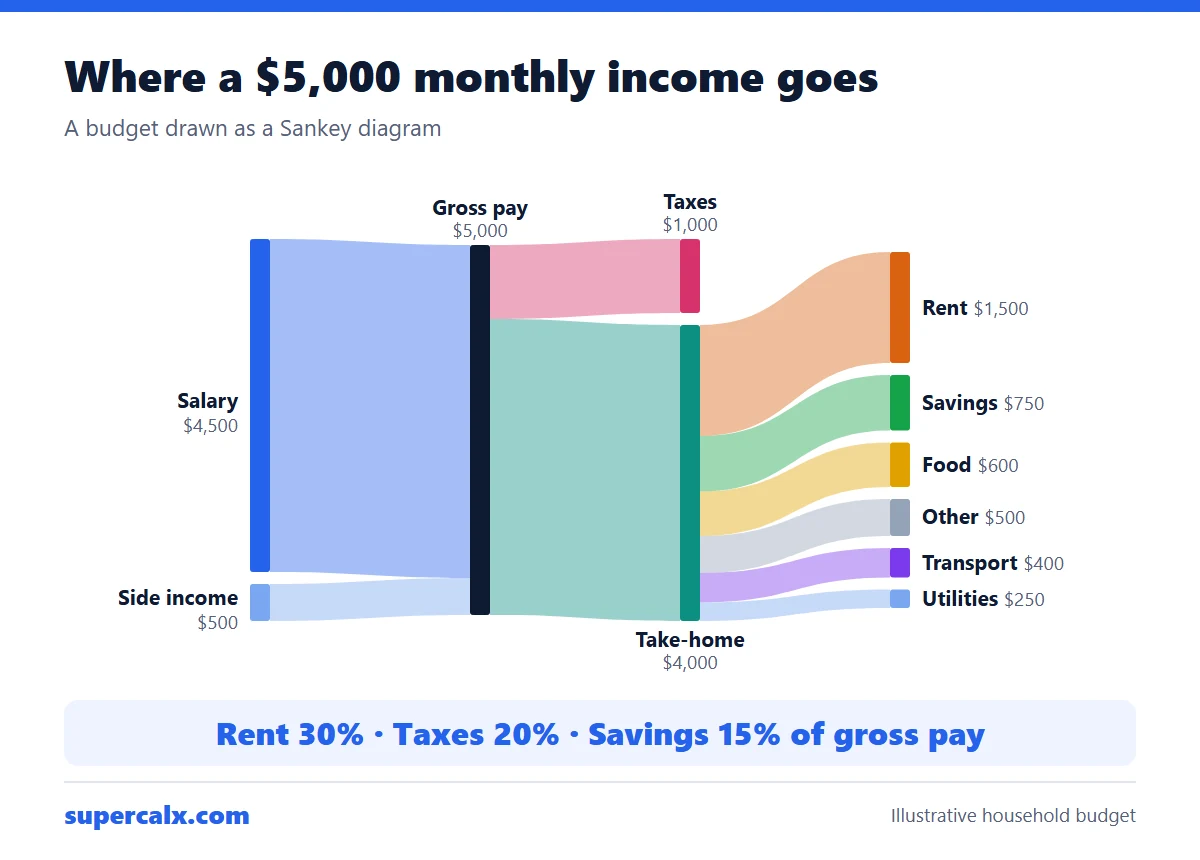 Sankey Diagram for a Budget: See Where Your Money Goes
 Energy Sankey Diagram: How to Draw One and Find Efficiency