
How to Write a Grant Proposal Timeline (With Example)
By Dr. Ahmed Mortuza Saleque · Updated · How we check our content
The short answer
A grant proposal timeline shows when each activity, milestone and deliverable happens during the funded period, usually in months from the award date. Write a short paragraph explaining the phases, then give a table or Gantt chart with each activity, its months, who leads it and what it produces. Make sure the timeline, the budget and the objectives tell the same story.
Open the Gantt Chart Maker →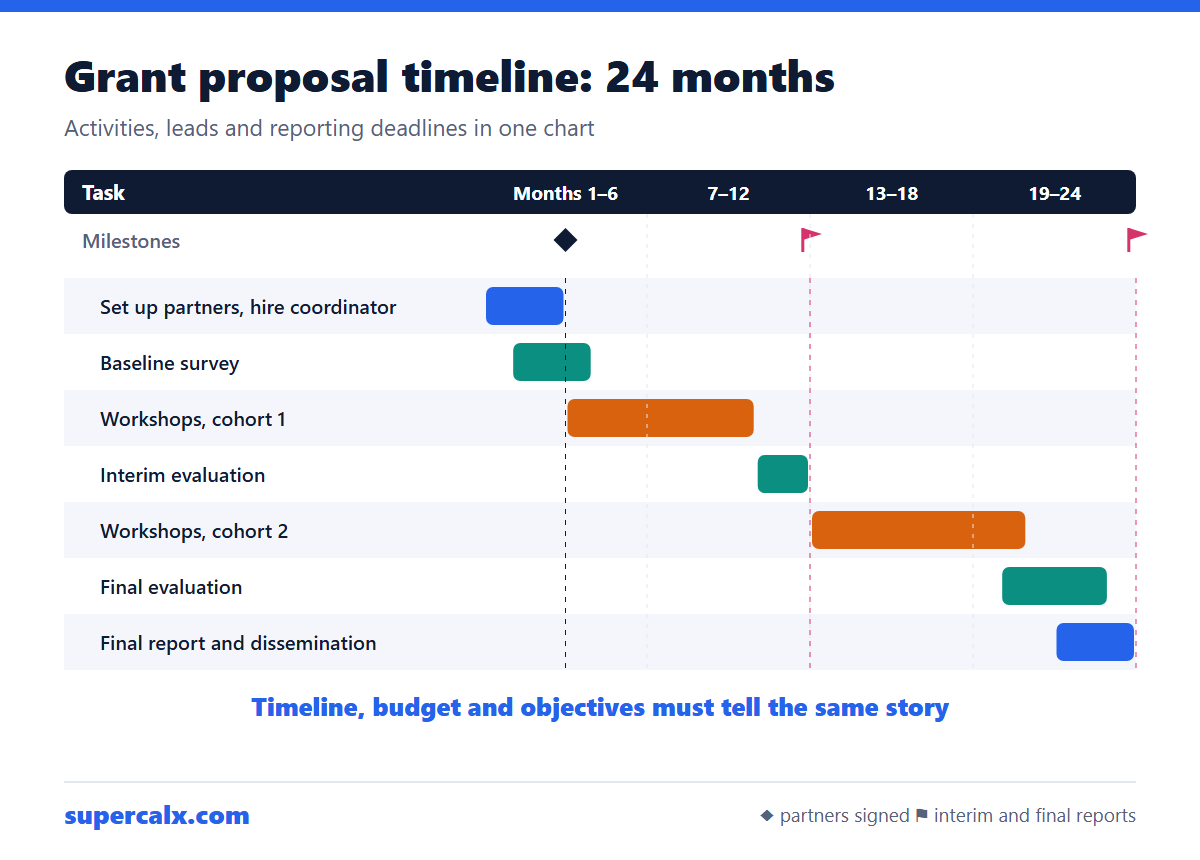
What the timeline section must include
- Each objective or activity, in the order it happens.
- Start and end month for each, counted from the award (Month 1).
- Who is responsible.
- Milestones and deliverables, with dates.
- Funder reporting deadlines, such as an interim report at Month 12.
- A sentence on risks to the schedule and what you will do if one slips.
Example: a 24-month community programme
| Activity | Months | Lead | Output |
|---|---|---|---|
| Hire coordinator, set up partners | M1–M3 | Director | Signed partner agreements |
| Baseline survey | M2–M4 | Evaluator | Baseline report |
| Deliver workshops, cohort 1 | M4–M10 | Coordinator | 120 participants |
| Interim evaluation | M11–M12 | Evaluator | Interim report (M12) |
| Deliver workshops, cohort 2 | M13–M20 | Coordinator | 150 participants |
| Final evaluation | M20–M23 | Evaluator | Evaluation report |
| Final report and dissemination | M22–M24 | Director | Final report (M24) |
Turned into a Gantt chart, the two delivery cohorts and the evaluation points are visible at a glance, which is why many funders prefer a chart to a table. Paste the rows into the Gantt Chart Maker as name | lead | M4-M10 and add Deadline: Interim report | M12.
A sample timeline paragraph
The project runs for 24 months in three phases. Months 1 to 3 set up partnerships and hire the coordinator. Months 4 to 20 deliver two workshop cohorts, with an interim evaluation in Months 11 and 12 so that lessons from cohort 1 shape cohort 2. Months 20 to 24 cover the final evaluation and report. The Gantt chart in Figure 1 shows each activity, its lead and the reporting deadlines.
Keep it consistent with the budget
Reviewers cross-check. If the coordinator starts in Month 1, the budget should pay them from Month 1; if surveys run in Months 2 to 4, the survey costs belong in year 1. Total the costs by year with the business budget calculator. If the funder needs calendar dates, count months from the expected start with the date calculator.
Common questions
How do you write a timeline for a grant proposal?
List each activity with its start and end month from the award date, its lead and its output, add milestones and reporting dates, then show it as a table or Gantt chart with a short explanatory paragraph.
Should a grant timeline use dates or months?
Months from the award (Month 1, Month 2) unless the funder asks for dates, because start dates often move.
How long is the timeline section of a grant proposal?
Often half a page to a page: a paragraph plus one table or chart.
Is a Gantt chart required in a grant proposal?
Not always, but it is the clearest way to show a multi-activity schedule and is expected by many research funders.
Calculators for this article
More from the blog
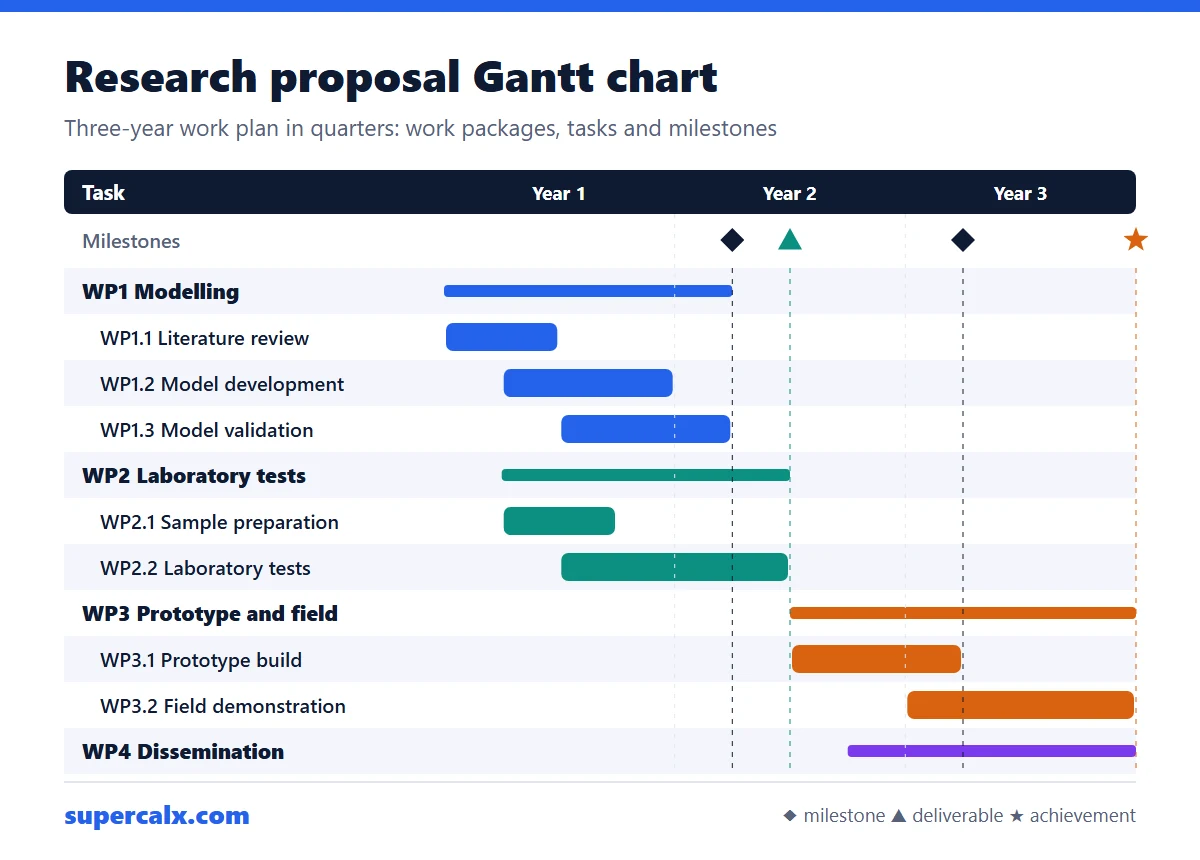 Gantt Chart for a Research Proposal: Example and Template
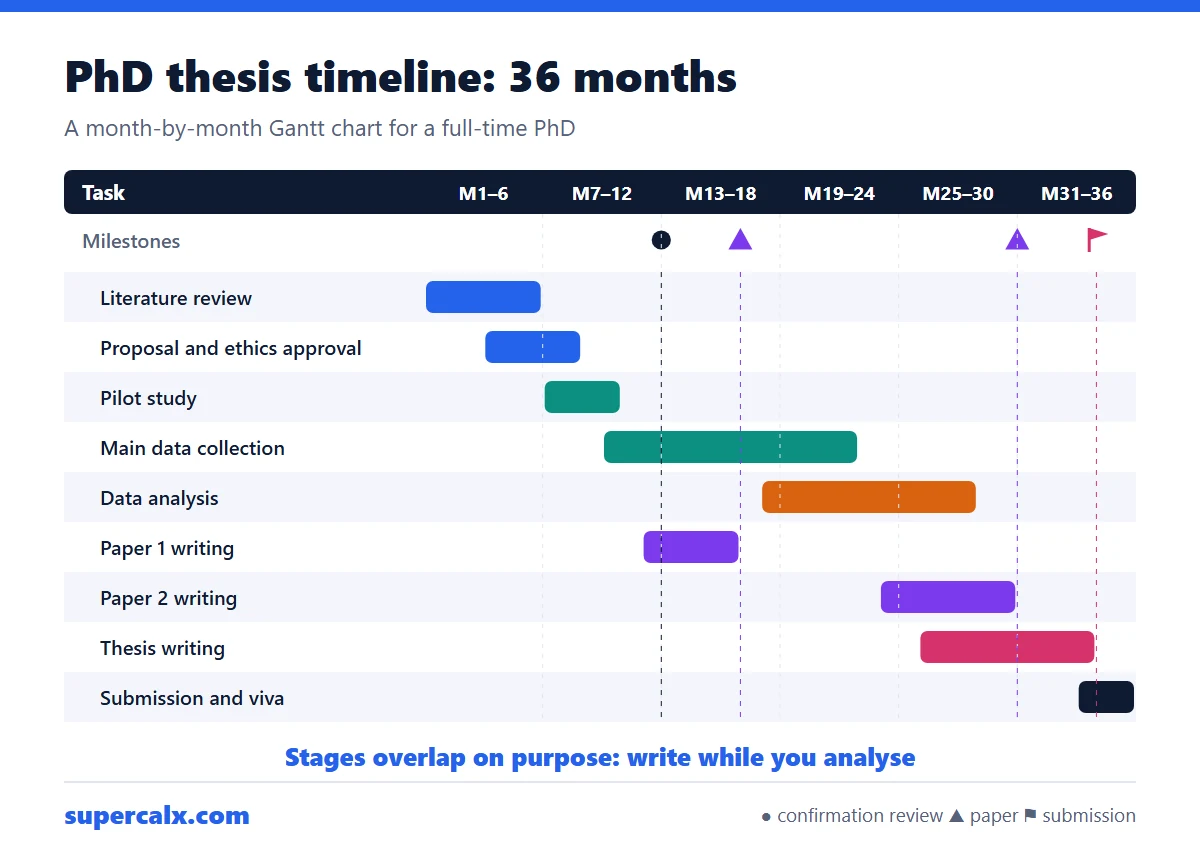 PhD and Thesis Gantt Chart: Timeline Example by Month
 Gantt Chart Milestones and Deliverables: How to Show Them
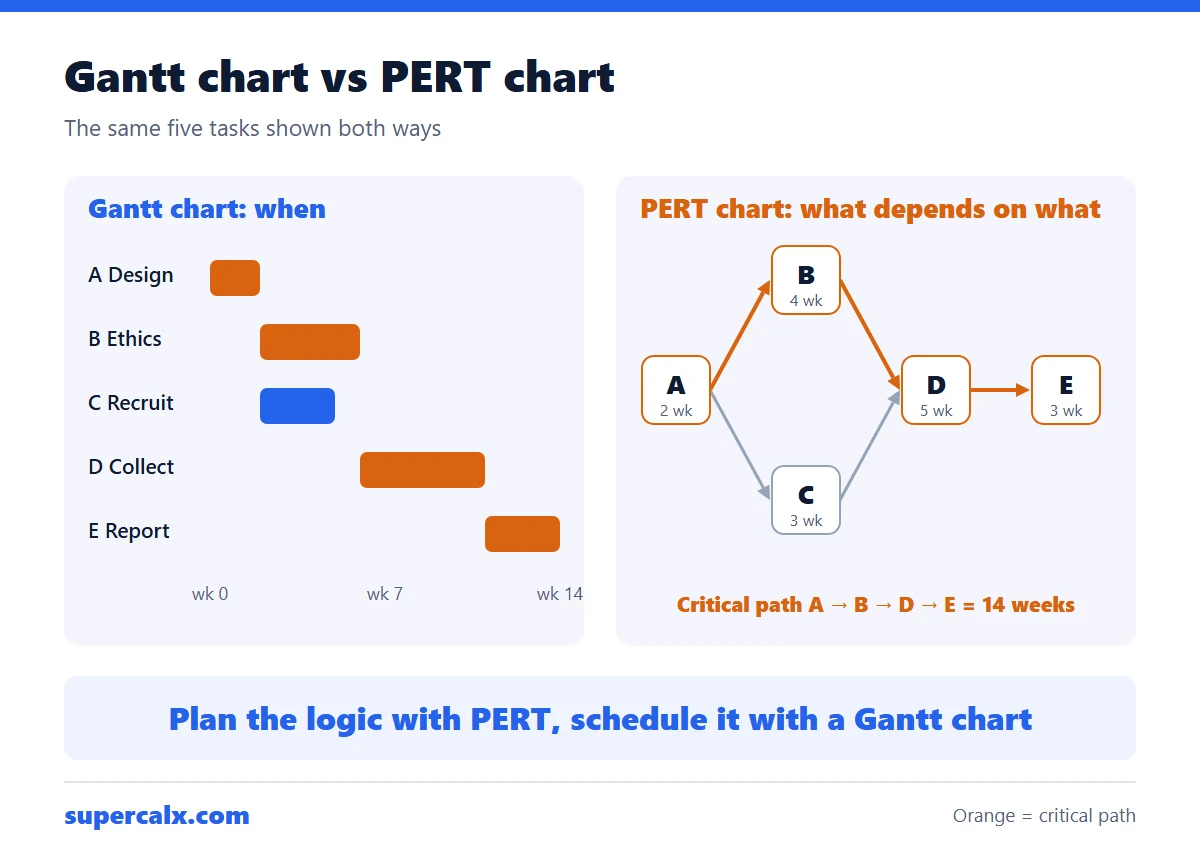 Gantt Chart vs PERT Chart vs Timeline: Which to Use
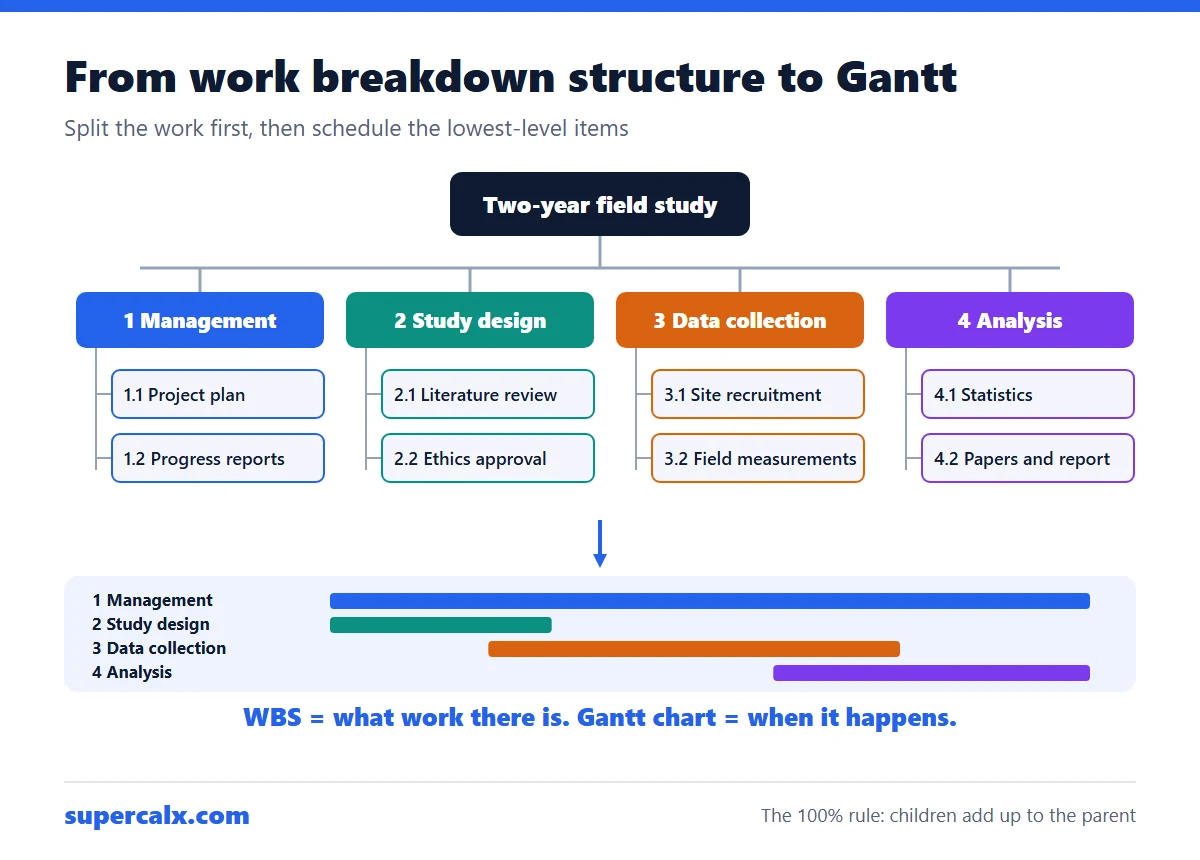 Work Breakdown Structure Example: From WBS to Gantt Chart
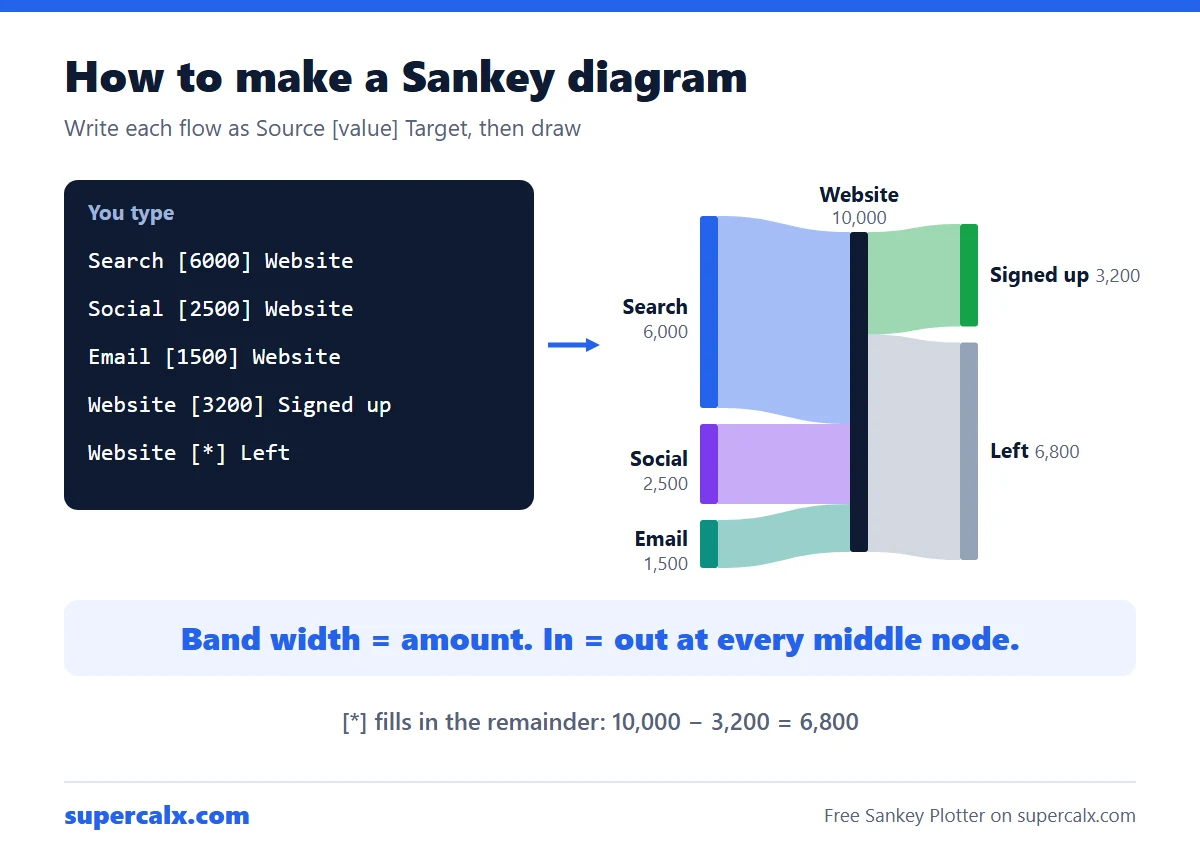 How to Make a Sankey Diagram (Free, No Excel Add-in)
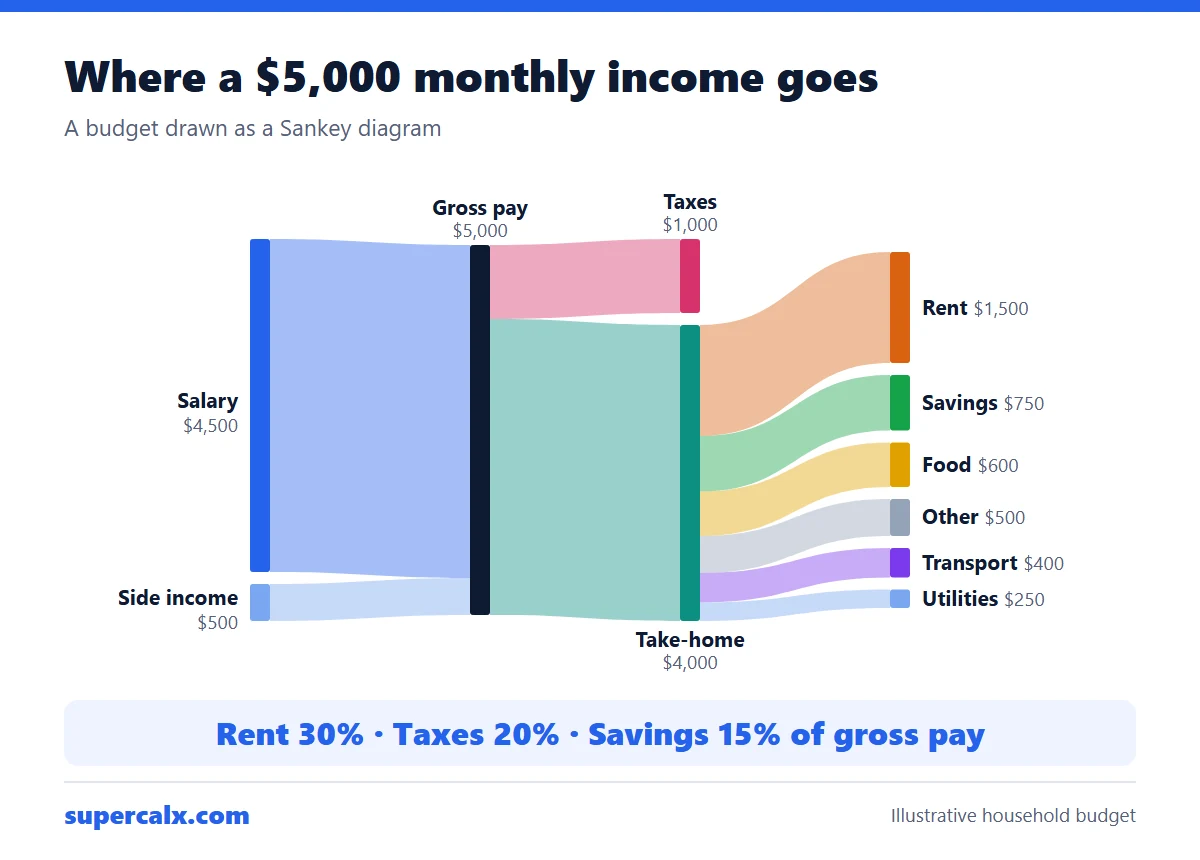 Sankey Diagram for a Budget: See Where Your Money Goes
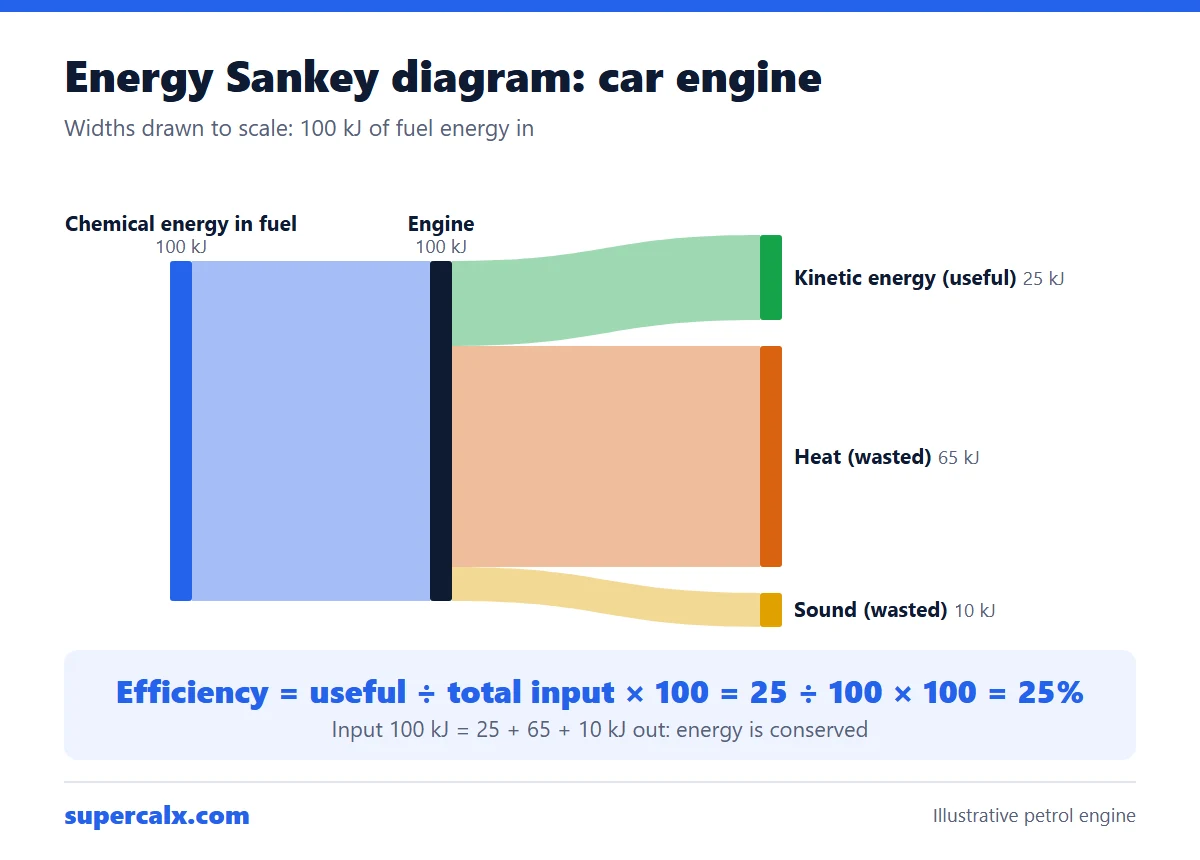 Energy Sankey Diagram: How to Draw One and Find Efficiency