
Gantt Chart vs PERT Chart vs Timeline: Which to Use
By Dr. Ahmed Mortuza Saleque · Updated · How we check our content
The short answer
A Gantt chart is a bar chart of tasks against a calendar, so it shows when each task happens and how long it takes. A PERT chart is a network of boxes and arrows that shows which tasks depend on which, and helps find the critical path. A timeline only shows key dates. Use PERT to plan the logic, then a Gantt chart to schedule and communicate it.
Open the Gantt Chart Maker →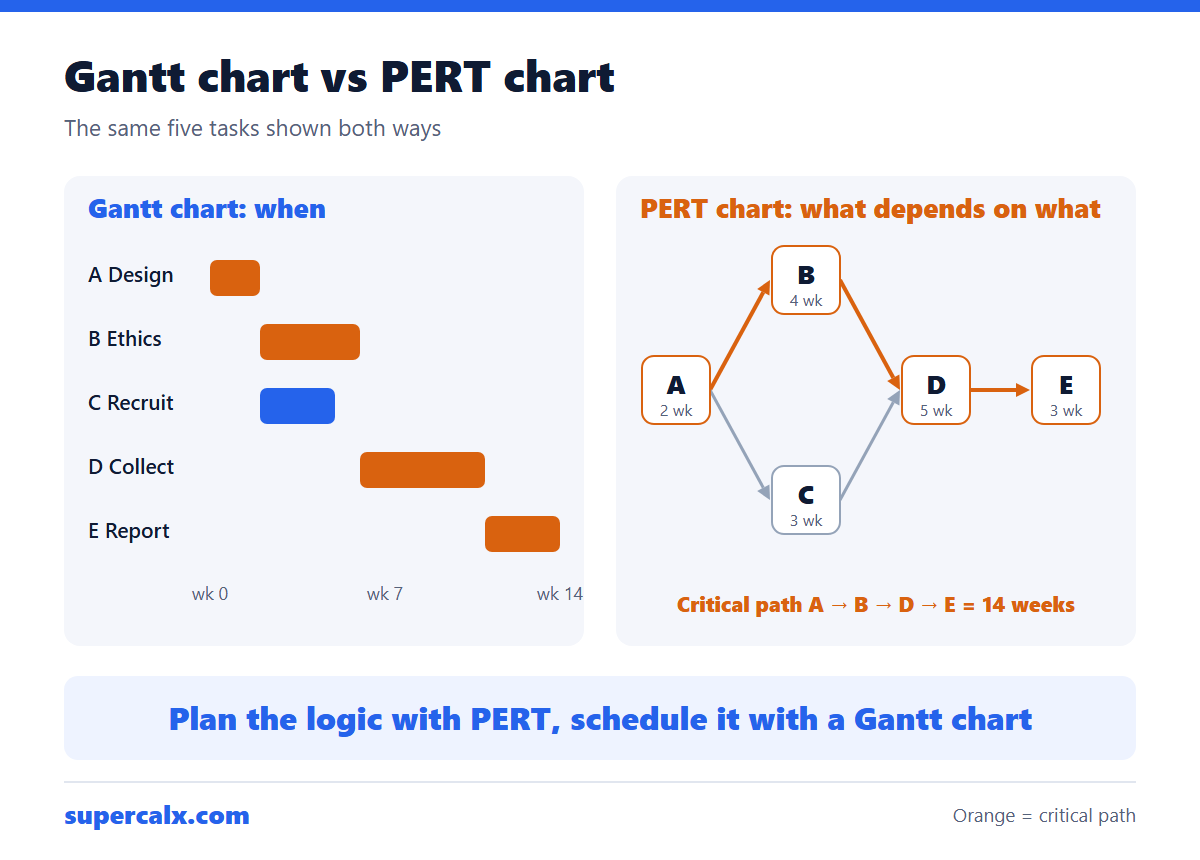
Side by side
| Gantt chart | PERT chart | Timeline | |
|---|---|---|---|
| Shape | Bars on a calendar | Boxes joined by arrows | Points on a line |
| Best at | When and how long | Order and dependencies | Key dates at a glance |
| Shows durations | Yes, bar length | As numbers in boxes | Rarely |
| Shows dependencies | Optional arrows | Yes, the whole point | No |
| Critical path | Can be highlighted | Found directly | No |
| Easy for funders and clients | Yes | Less so | Yes |
Worked example: five tasks
A small study, with durations in weeks and what each task must wait for.
| Task | Weeks | Depends on |
|---|---|---|
| A. Design survey | 2 | – |
| B. Ethics approval | 4 | A |
| C. Recruit participants | 3 | A |
| D. Collect data | 5 | B and C |
| E. Analyse and report | 3 | D |
Finding the critical path
- Path A → B → D → E takes 2 + 4 + 5 + 3 = 14 weeks.
- Path A → C → D → E takes 2 + 3 + 5 + 3 = 13 weeks.
- The longest path, A → B → D → E, is the critical path: the project cannot finish in under 14 weeks.
- Task C has 1 week of slack. It can start a week late without delaying the end.
A PERT chart makes this logic visible. A Gantt chart then places the same tasks on a calendar: in the Gantt Chart Maker you can link each task to the one it waits for and show the arrows.
Three-point estimates in PERT
PERT originally estimated each task with three numbers: optimistic (O), most likely (M) and pessimistic (P). The expected time is (O + 4M + P) ÷ 6. Ethics approval with O = 3, M = 4 and P = 8 weeks gives (3 + 16 + 8) ÷ 6 = 4.5 weeks. The method puts weight on the most likely value while still accounting for a long tail.
And Kanban or a roadmap?
- Kanban board: columns of cards (to do, doing, done). Good for ongoing work without fixed dates; no time axis.
- Roadmap: a high-level Gantt chart of themes or releases by quarter, with little task detail. The Roadmap style in the Gantt Chart Maker gives this look.
Common questions
Is a PERT chart better than a Gantt chart?
Neither is better; they answer different questions. PERT shows dependencies and the critical path, Gantt shows the schedule. Many projects use both.
What does PERT stand for?
Program Evaluation and Review Technique, developed for the U.S. Navy Polaris missile programme in the late 1950s.
Can a Gantt chart show dependencies?
Yes. Arrows from the end of one bar to the start of another show that a task waits for another.
What is the difference between a Gantt chart and a timeline?
A timeline marks dates and events on a single line. A Gantt chart gives each task its own row and a bar showing how long it lasts.
Calculators for this article
More from the blog
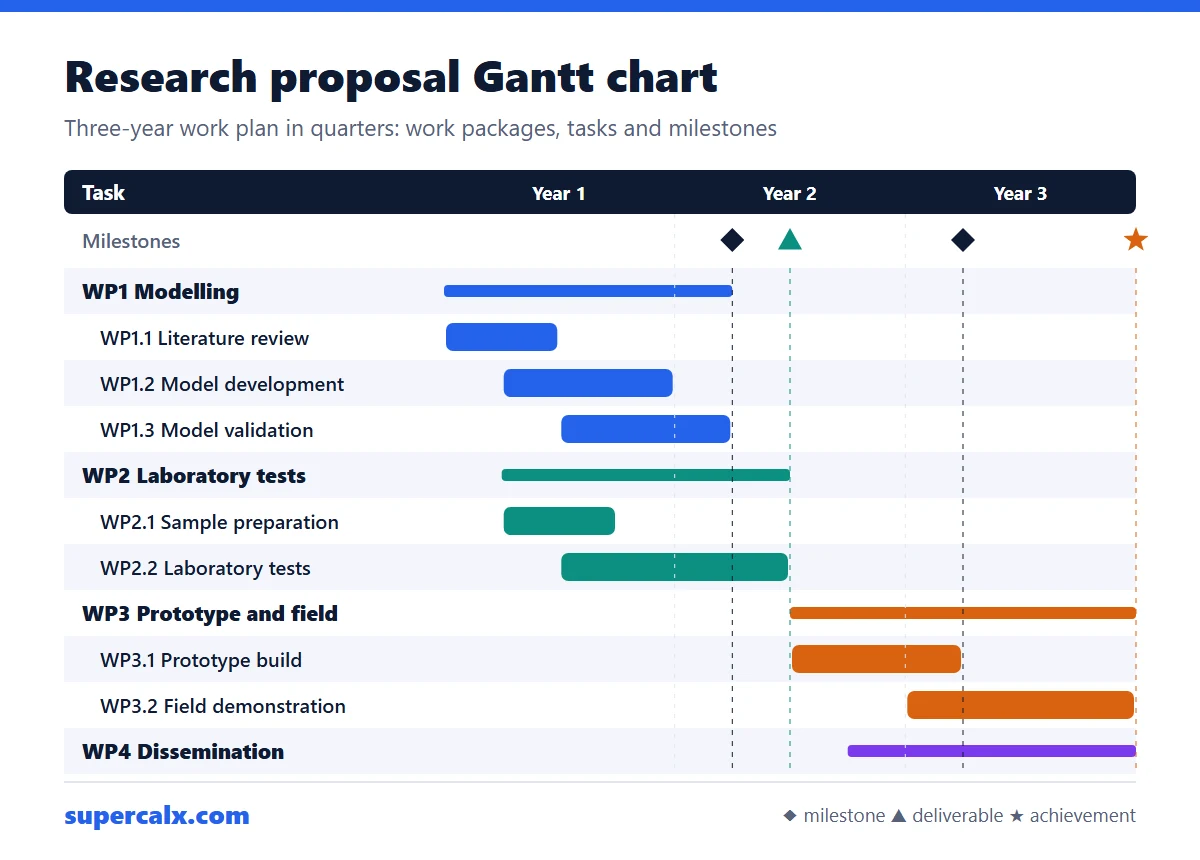 Gantt Chart for a Research Proposal: Example and Template
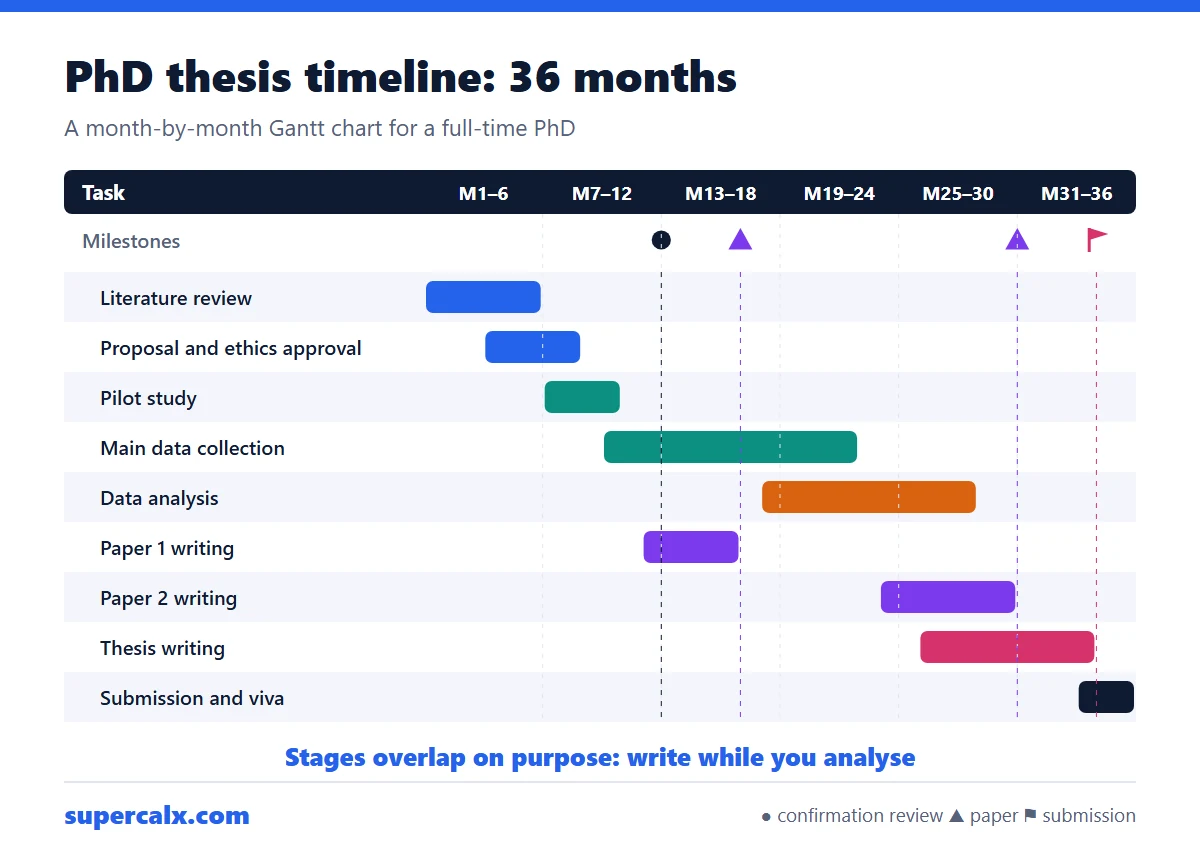 PhD and Thesis Gantt Chart: Timeline Example by Month
 Gantt Chart Milestones and Deliverables: How to Show Them
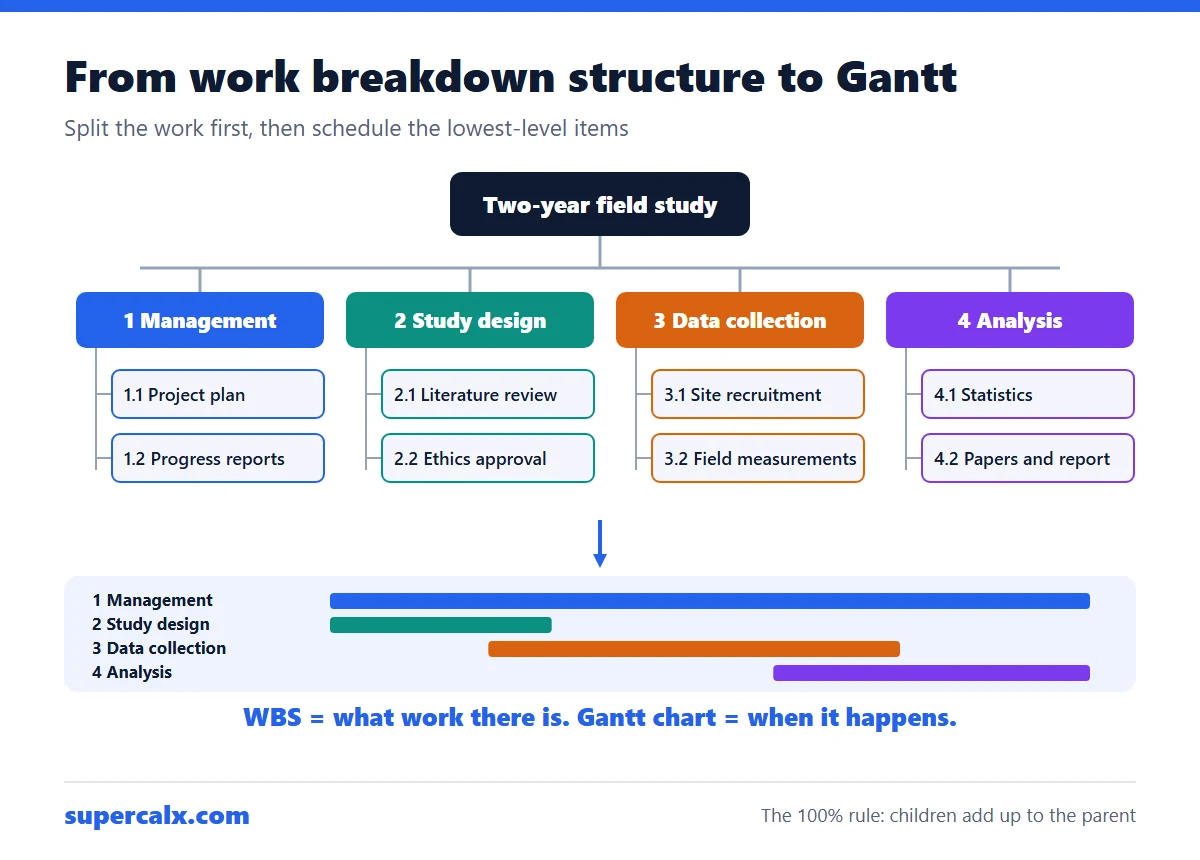 Work Breakdown Structure Example: From WBS to Gantt Chart
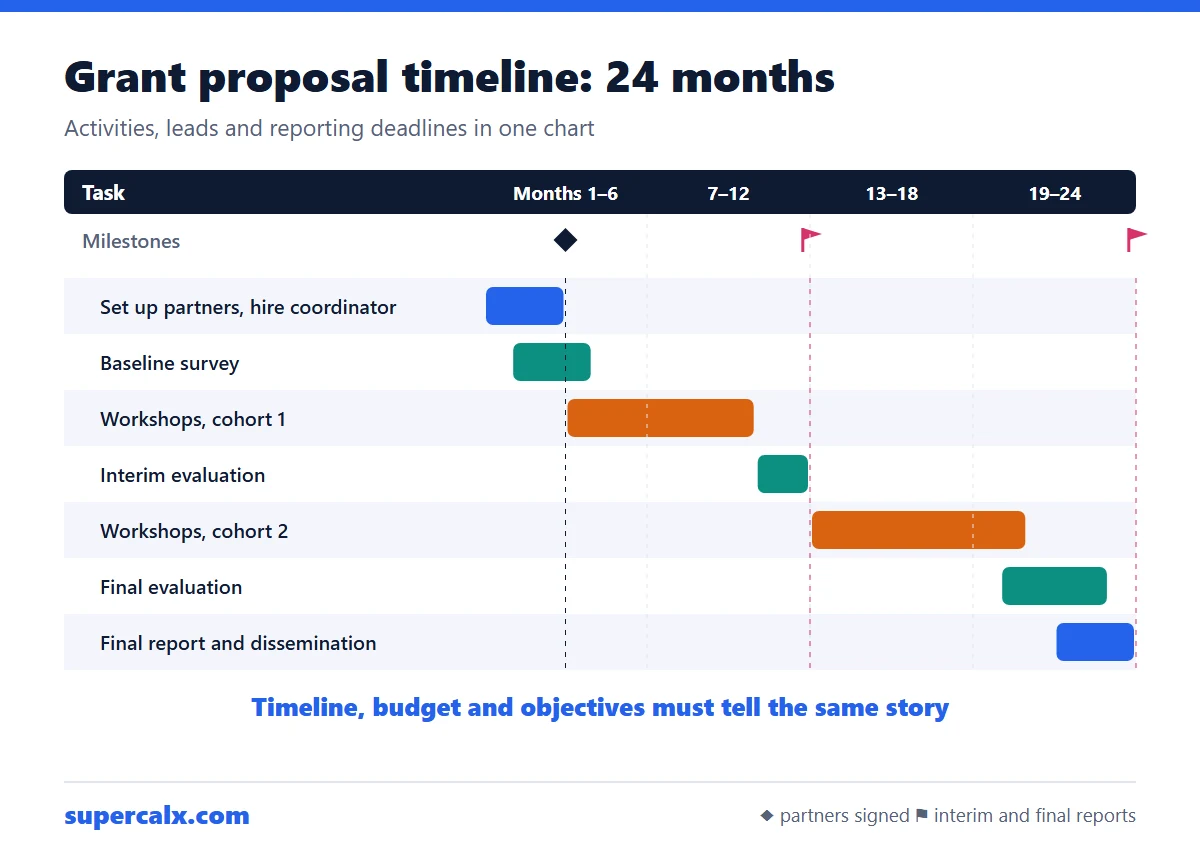 How to Write a Grant Proposal Timeline (With Example)
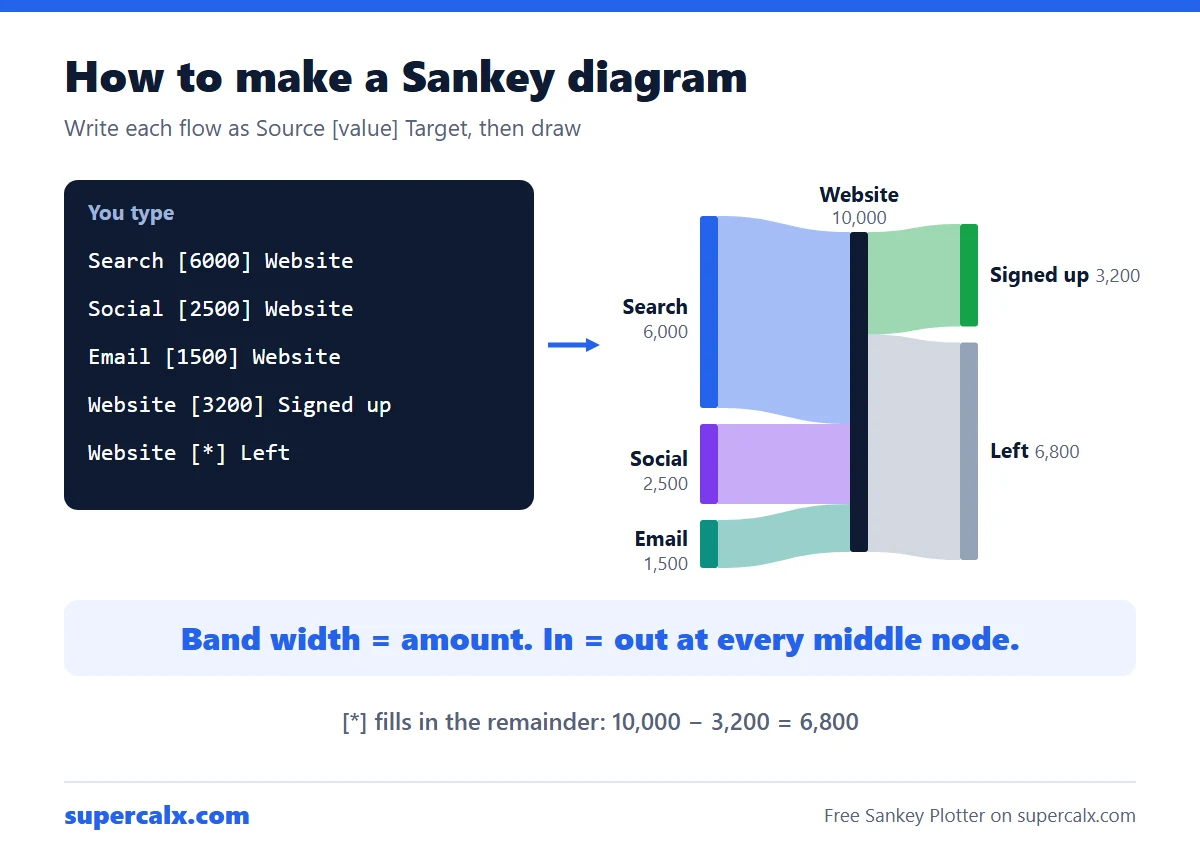 How to Make a Sankey Diagram (Free, No Excel Add-in)
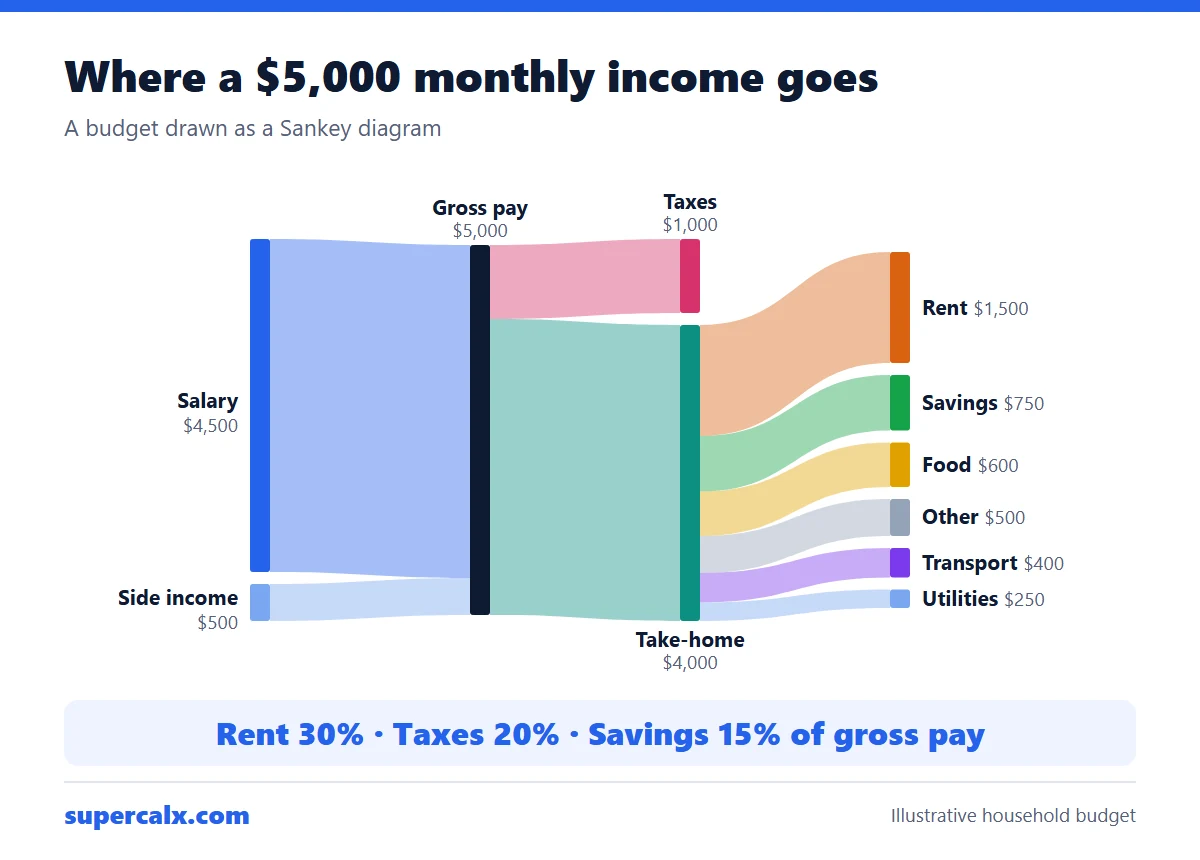 Sankey Diagram for a Budget: See Where Your Money Goes
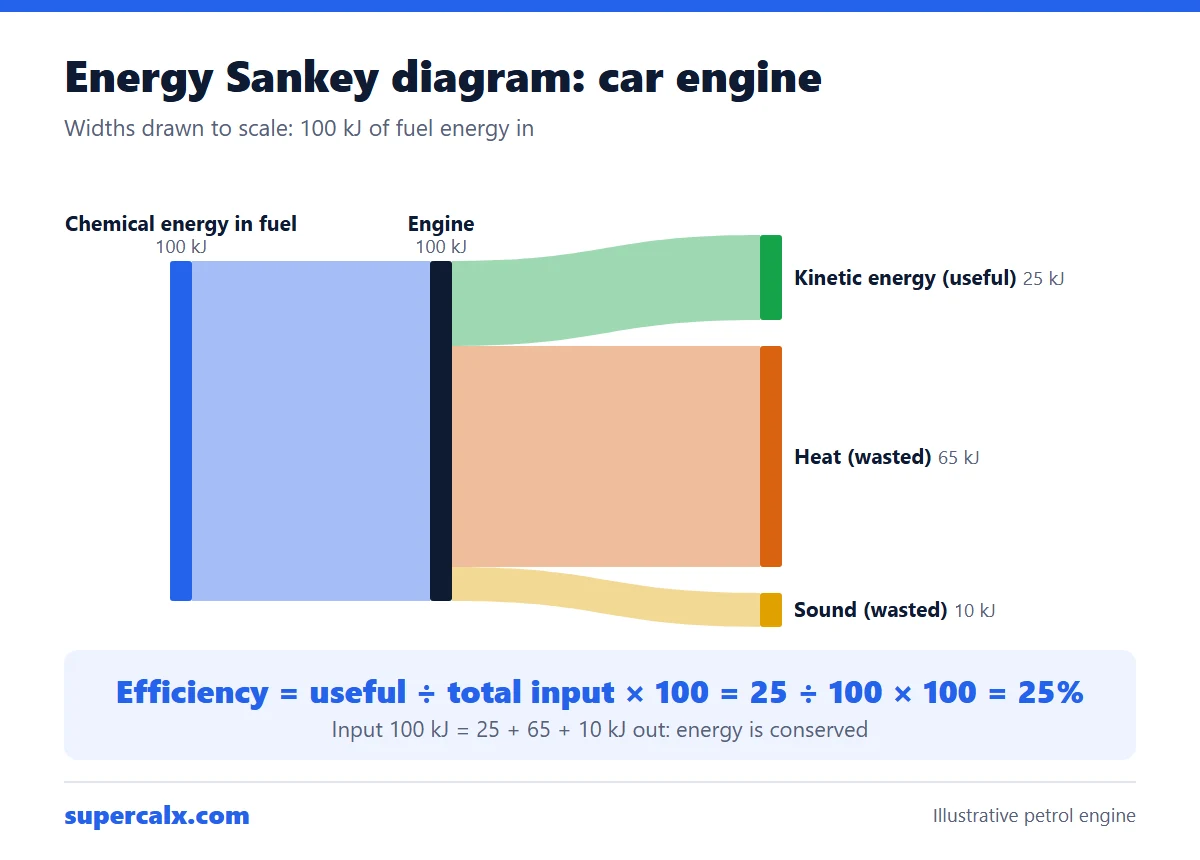 Energy Sankey Diagram: How to Draw One and Find Efficiency