
How to Make a Sankey Diagram (Free, No Excel Add-in)
By Dr. Ahmed Mortuza Saleque · Updated · How we check our content
The short answer
To make a Sankey diagram, list every flow as source, amount and target, for example Salary [4000] Budget, then let a Sankey tool draw a band for each flow with a width proportional to the amount. Check that what flows into each middle node equals what flows out. The free SuperCalX Sankey Plotter draws it in your browser with no add-in or sign-up.
Open the Sankey Plotter →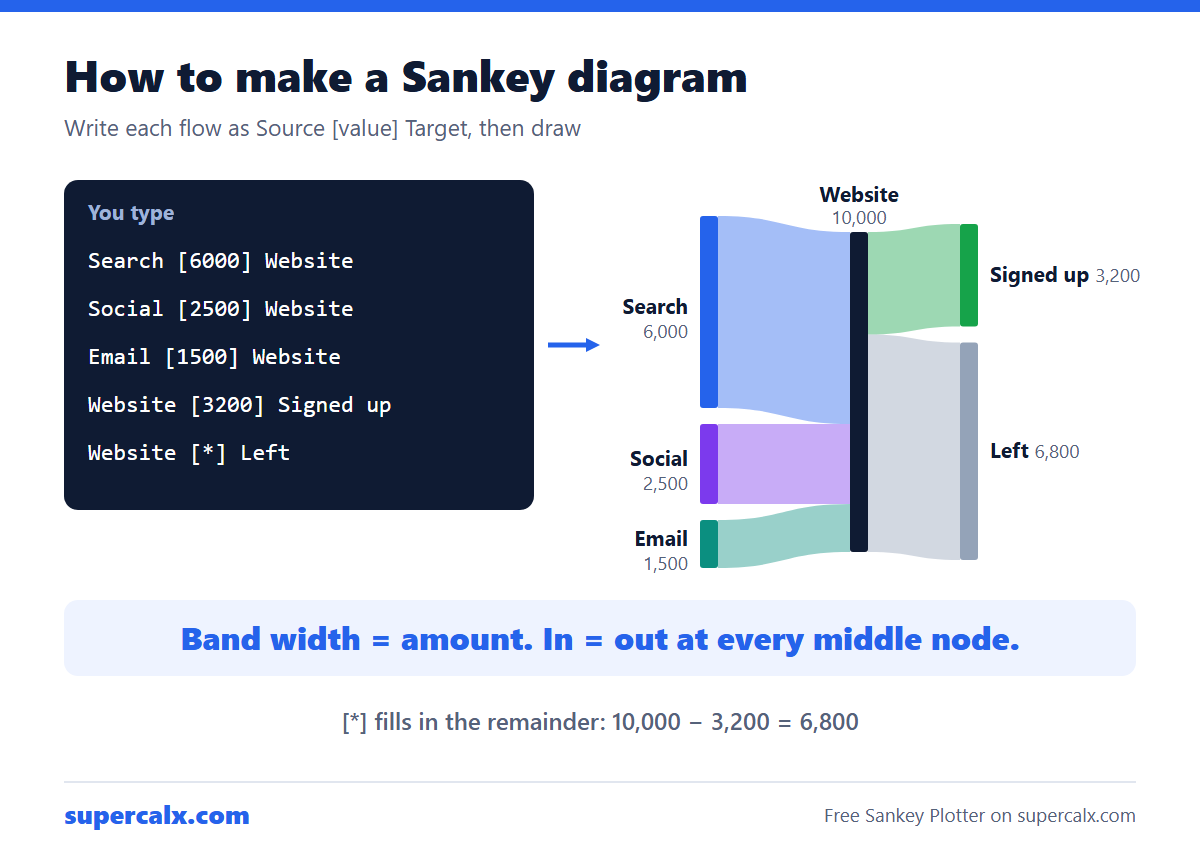
Step 1: write the flows as a list
Every Sankey diagram is a list of links, each with a source, a value and a target. A small website-traffic example:
| Line you type | Meaning |
|---|---|
| Search [6000] Website | 6,000 visits came from search |
| Social [2500] Website | 2,500 came from social media |
| Email [1500] Website | 1,500 came from email |
| Website [3200] Signed up | 3,200 visitors signed up |
| Website [*] Left | Everyone else left (auto-balanced: 6,800) |
Step 2: draw it
- Open the Sankey Plotter. A sample budget is already loaded, so you can see the format.
- Replace the text with your own lines, one flow per line, in the form Source [value] Target.
- Use [*] for a remainder: Website [*] Left takes whatever flows into Website minus the fixed outflows, so you do not have to subtract by hand.
- Colour a node with a line such as :Signed up #16a34a, or add a colour at the end of a flow line to colour just that band. Lines starting with // are comments.
- Choose a colour theme, node alignment and canvas size, drag nodes up or down to untangle bands, then click Download Image for a PNG at twice the screen size.
Step 3: check that it balances
In the example, 6,000 + 2,500 + 1,500 = 10,000 visits flow into Website, and 3,200 + 6,800 = 10,000 flow out. If inflow and outflow at a middle node differ, the node looks lopsided and readers lose trust. Work out each band's share with the percentage calculator: 3,200 of 10,000 is a 32% sign-up rate, a good label to add to the title.
Why not Excel or PowerPoint?
- Excel has no built-in Sankey chart type, so you need a paid add-in or a long workaround with stacked areas.
- PowerPoint and drawing tools make you draw each band by hand, and the widths are rarely to scale.
- Coding libraries (D3, Plotly, R ggalluvial) give full control but need programming.
- A text-based plotter is quickest for a one-off chart: the widths are always exact and you can edit a number and redraw.
Tips for a readable Sankey diagram
- Keep it to about 5 to 25 nodes. Beyond that, group small flows into Other.
- Order nodes so the biggest flows run straight and crossings are few.
- Use one colour per source, or colour the bands by where they go, not both.
- Put the units in the title (visits, $, kWh), because the diagram itself shows no axis.
Common questions
What data do you need for a Sankey diagram?
A list of flows, each with a source, a target and a non-negative value in the same unit.
Can Excel make a Sankey diagram?
Not natively. You need an add-in or a workaround. A browser tool such as the SuperCalX Sankey Plotter is quicker for most charts.
Can a Sankey diagram have negative values?
No. Band width shows an amount, so values must be zero or positive. Show losses as a flow to a Loss node instead.
How do I export a Sankey diagram?
In the Sankey Plotter, click Download Image to save a high-resolution PNG.
Calculators for this article
More from the blog
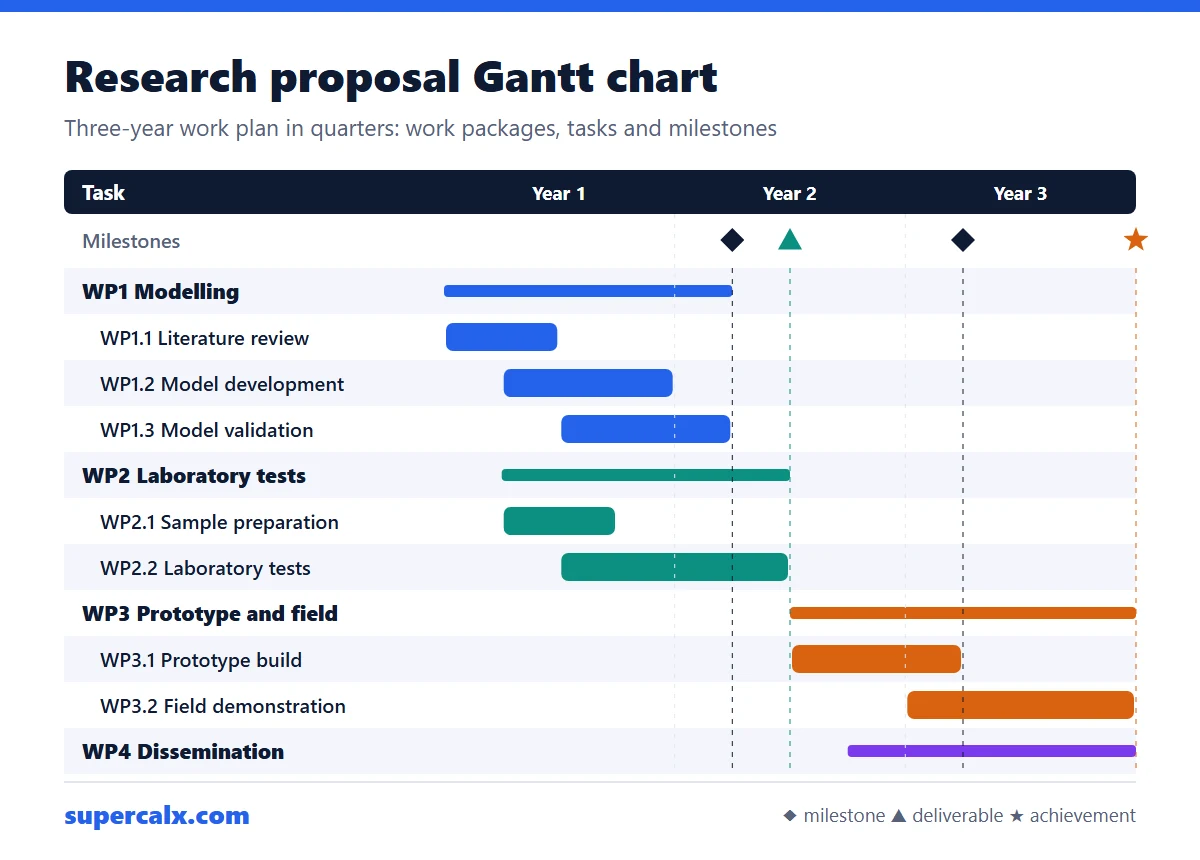 Gantt Chart for a Research Proposal: Example and Template
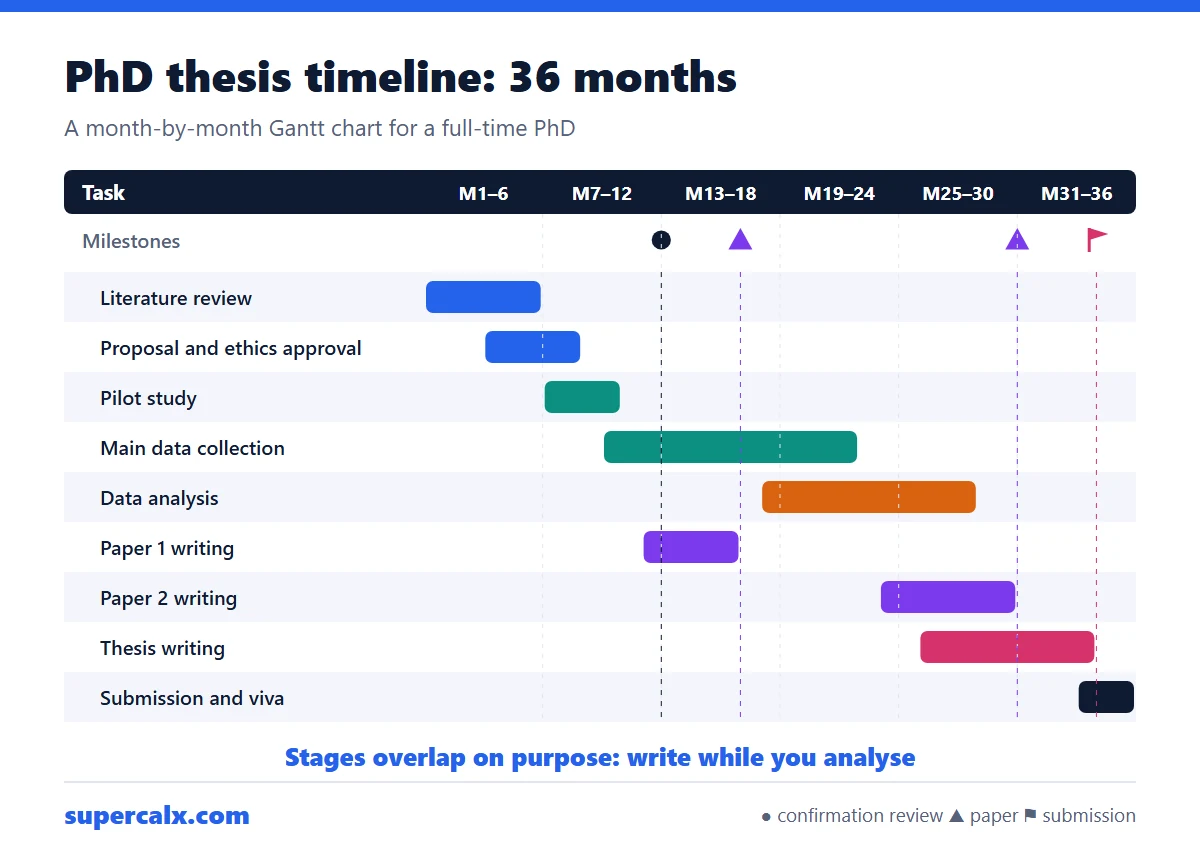 PhD and Thesis Gantt Chart: Timeline Example by Month
 Gantt Chart Milestones and Deliverables: How to Show Them
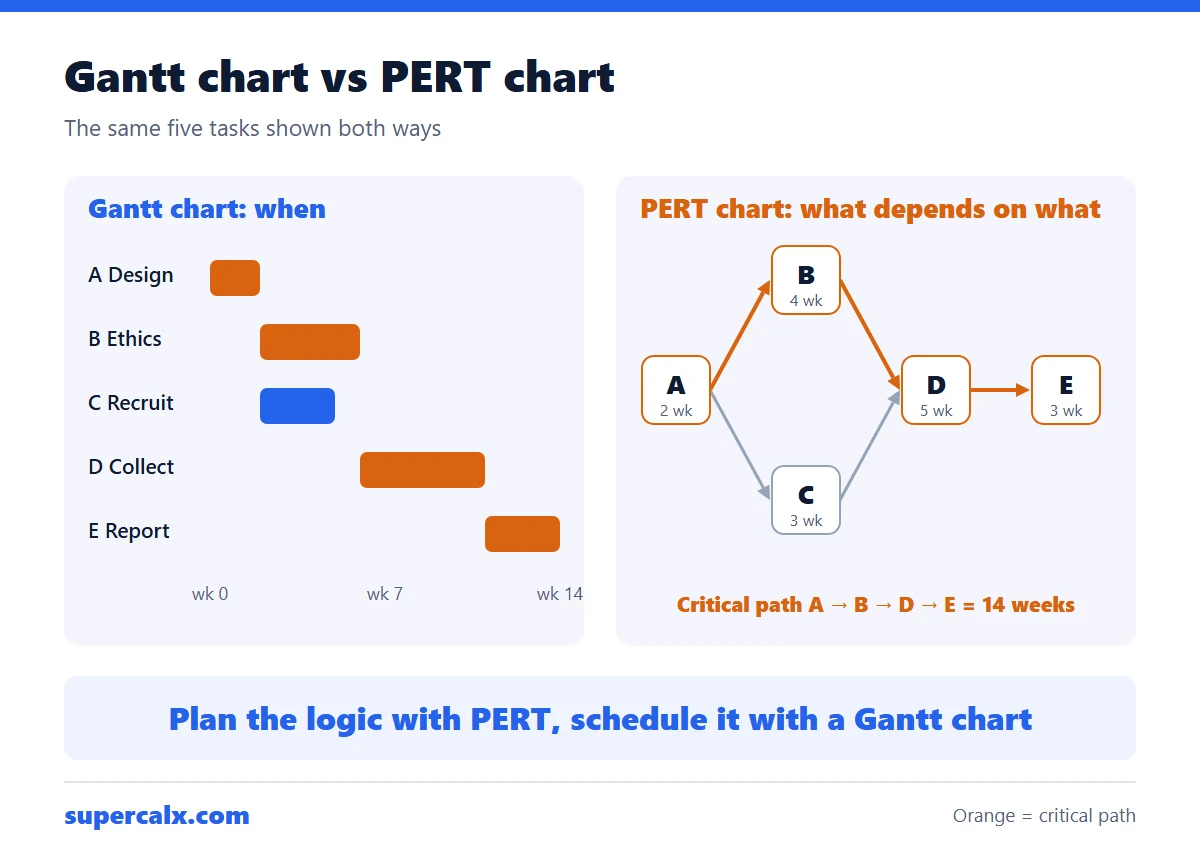 Gantt Chart vs PERT Chart vs Timeline: Which to Use
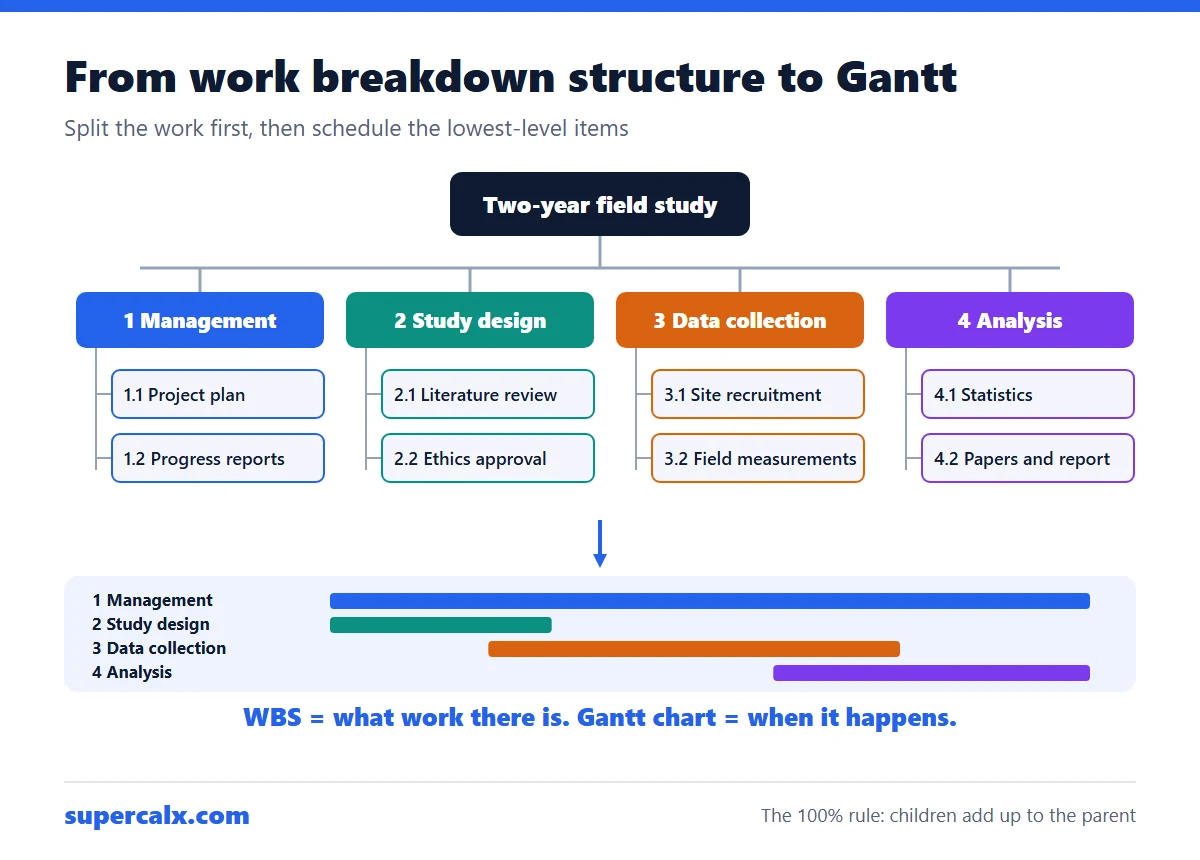 Work Breakdown Structure Example: From WBS to Gantt Chart
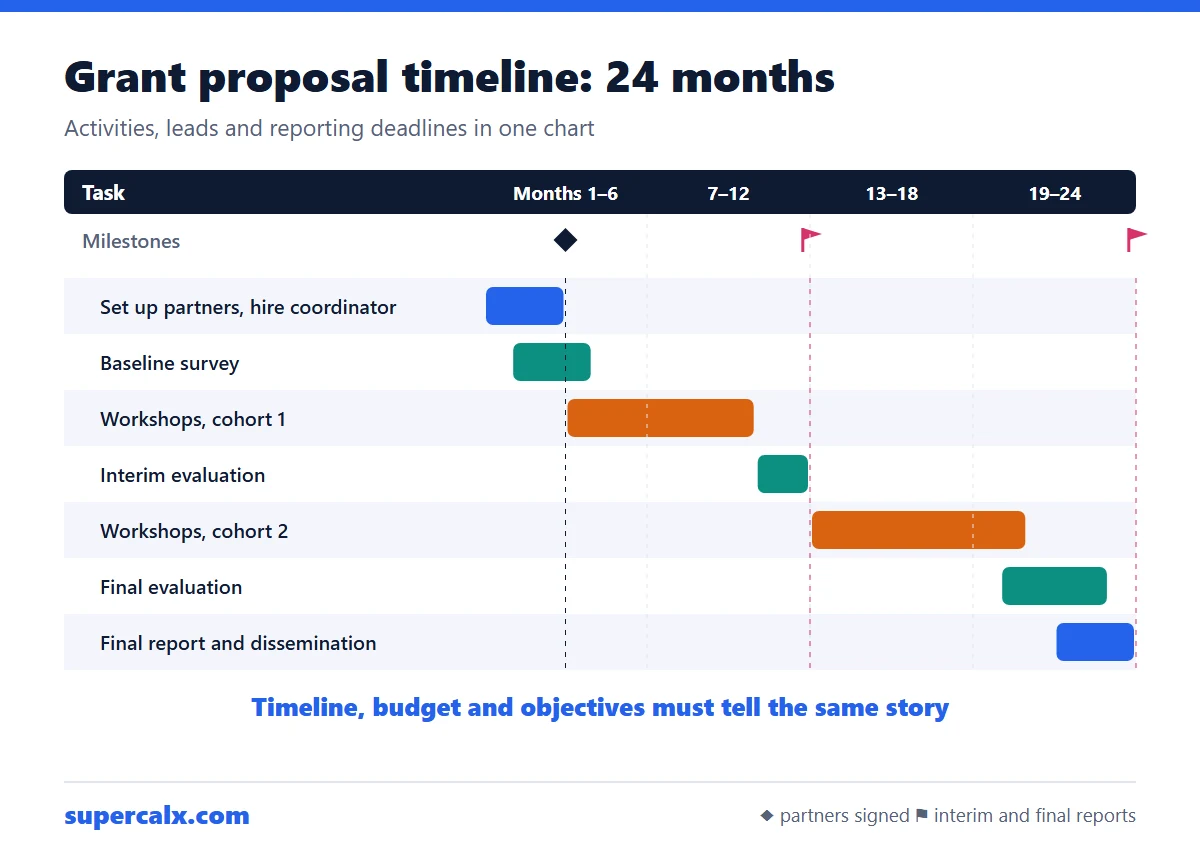 How to Write a Grant Proposal Timeline (With Example)
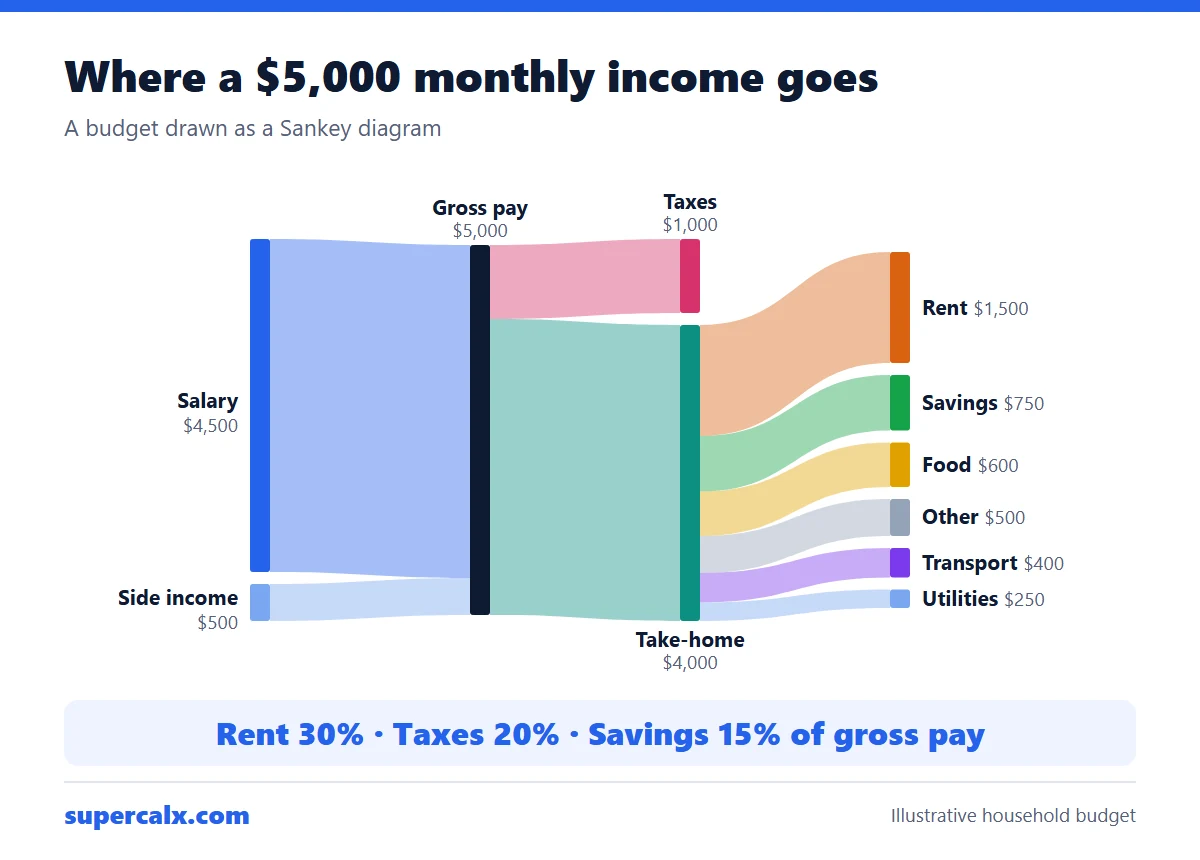 Sankey Diagram for a Budget: See Where Your Money Goes
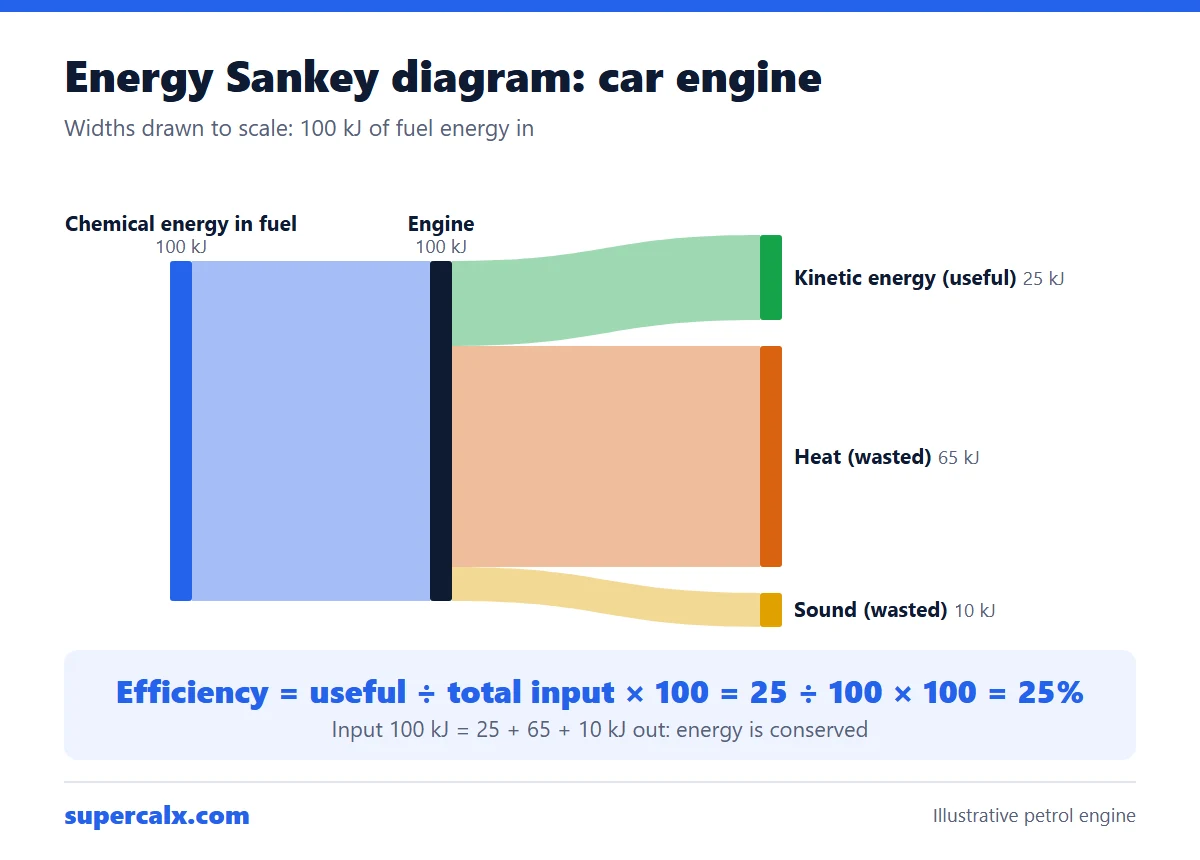 Energy Sankey Diagram: How to Draw One and Find Efficiency