Research tool · Free · No sign-up

Gantt Chart Maker

Paste your work plan and get a Gantt chart in seconds, or build one from scratch. Drag bars to change the timeline, add milestones and deliverables, pick from 16 styles and download a high-resolution image or PDF.

Sample Gantt charts

Made with this tool. Open any of them and change it to fit your project.
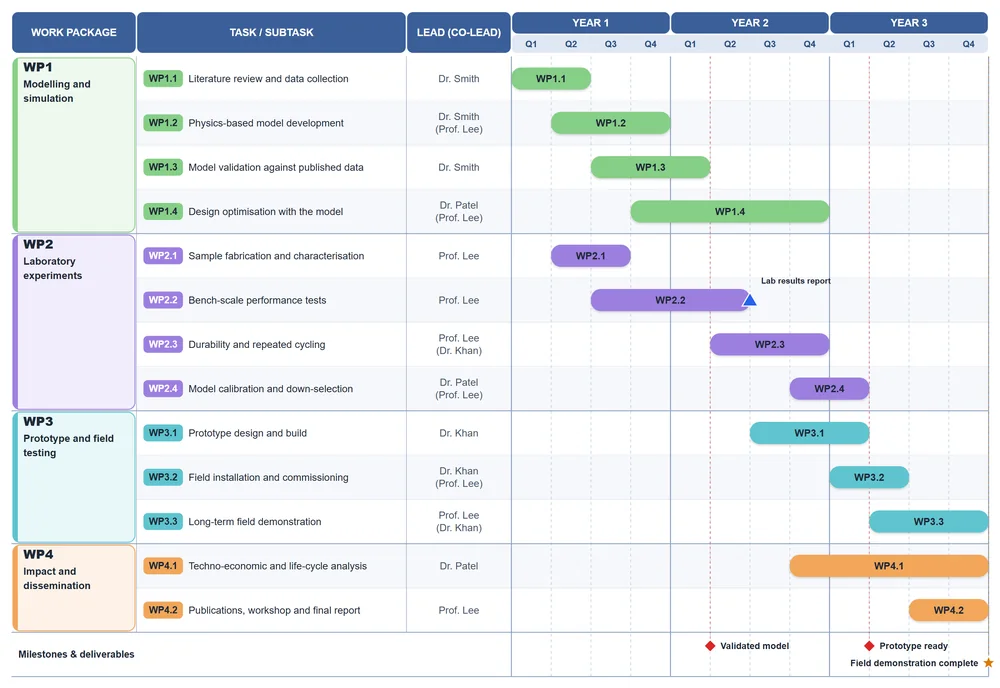
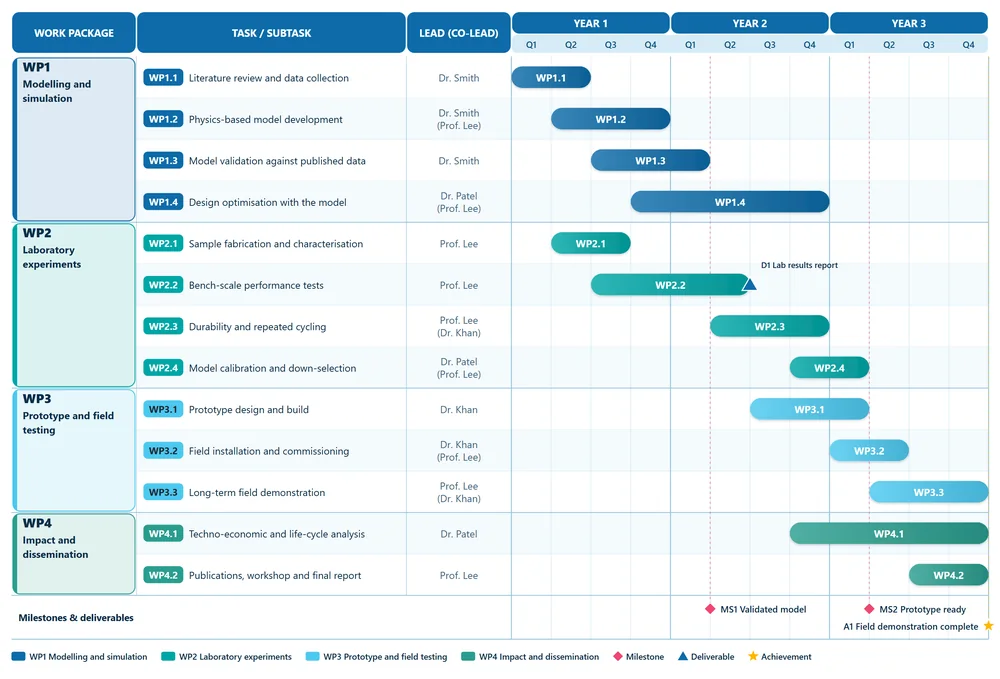
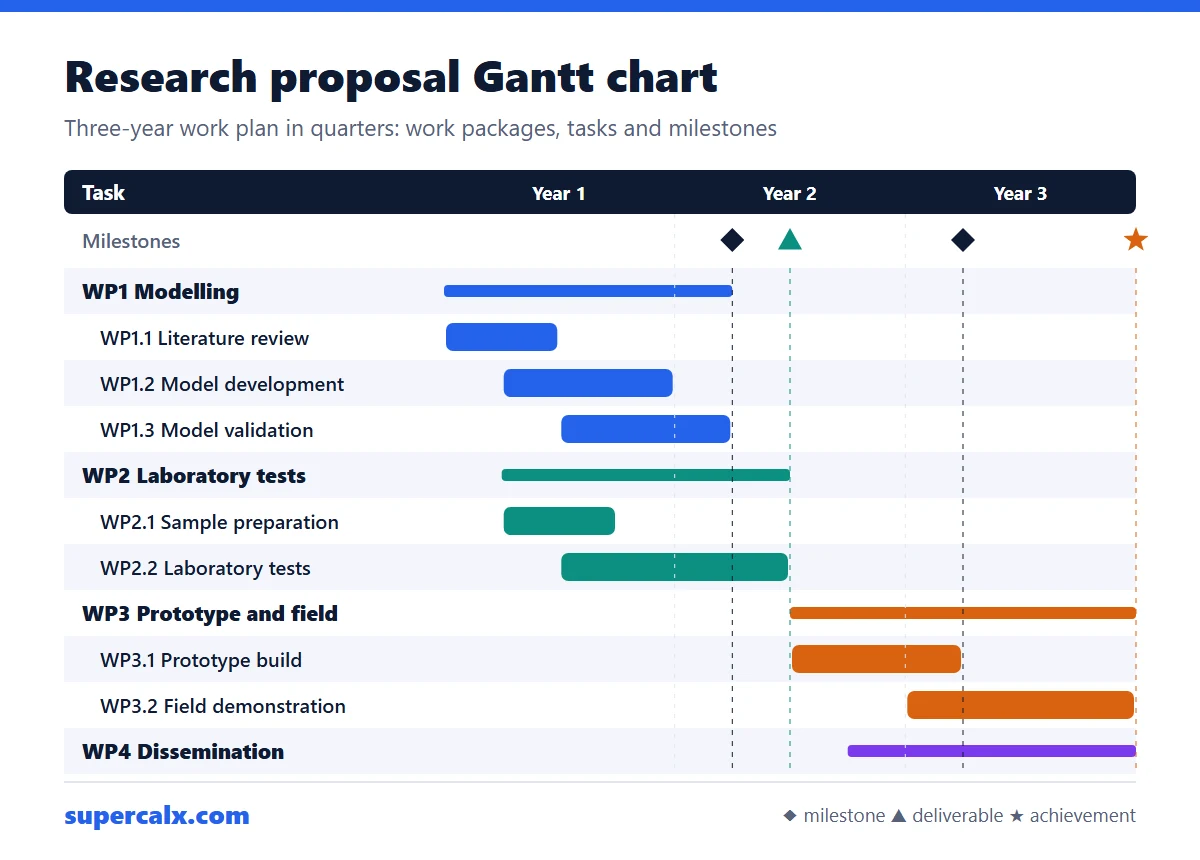
Research proposal Gantt chart with four coloured work packages, leads and milestones over three years
Research proposal3-year research proposal with work packages
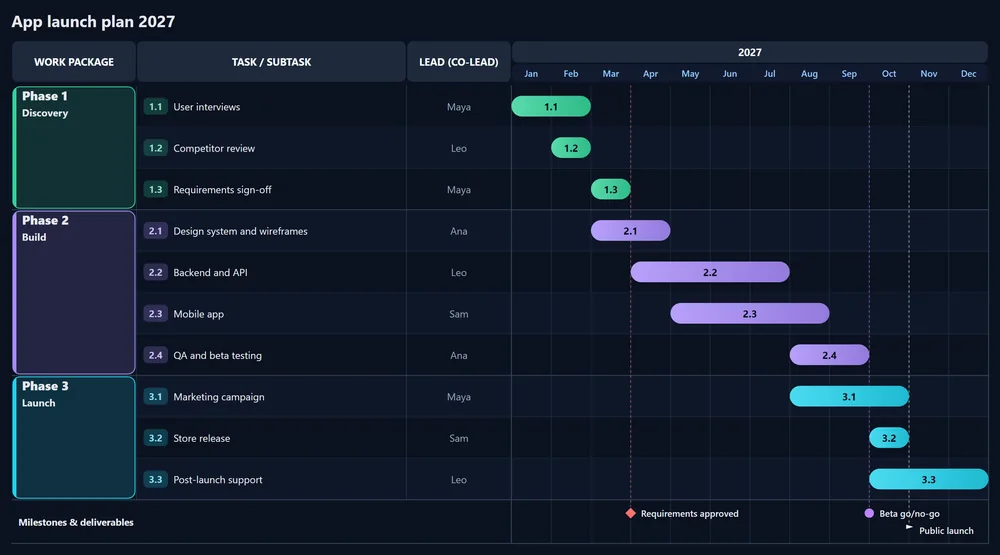
Dark Gantt chart of an app launch plan by month in 2027
Midnight (dark)Product launch on a dark background
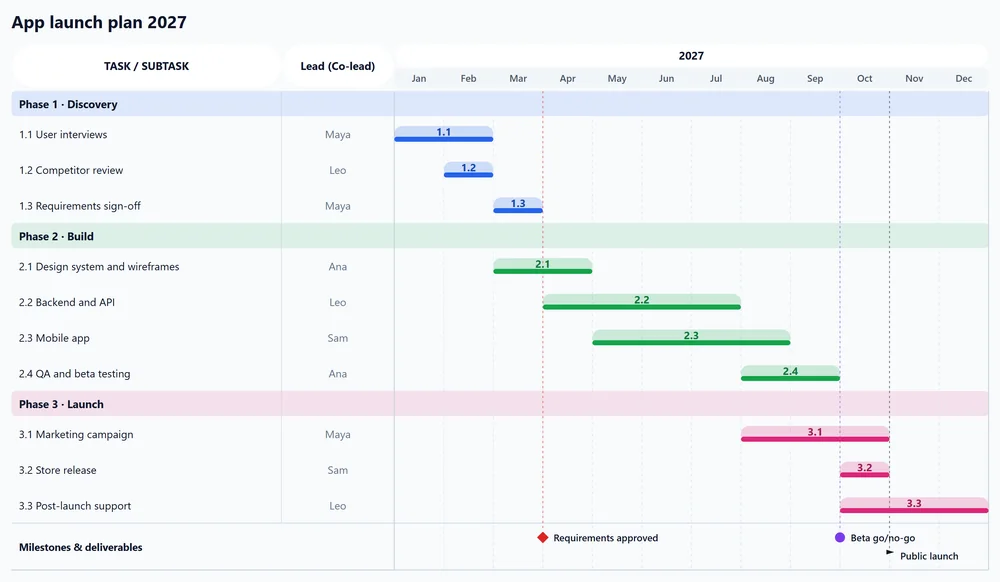
Roadmap-style Gantt chart with phases as swimlanes and slim rounded bars
RoadmapRoadmap with phases as lanes
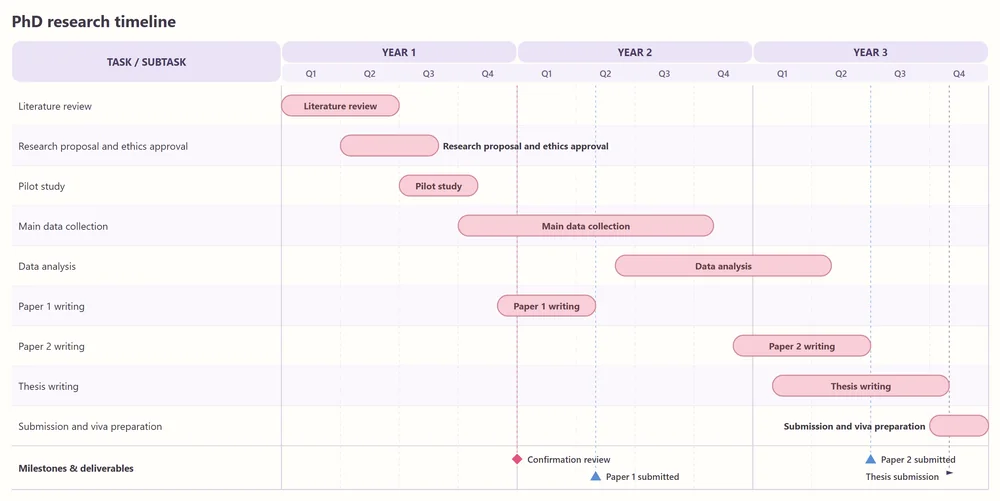
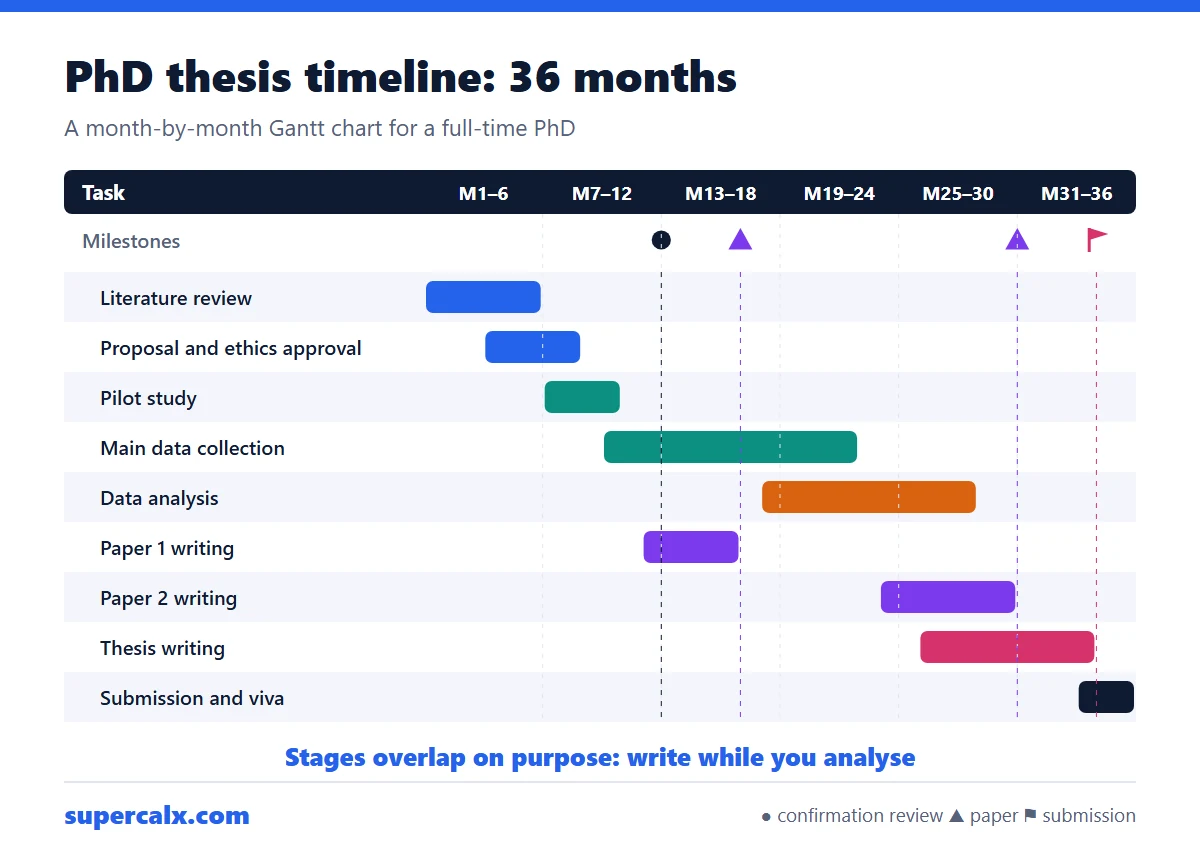
Pastel Gantt chart of a three-year PhD timeline with submission milestones
PastelPhD thesis timeline by month
Blue Gantt chart of a research project with numbered milestones MS1 and MS2
OceanProposal with numbered milestones
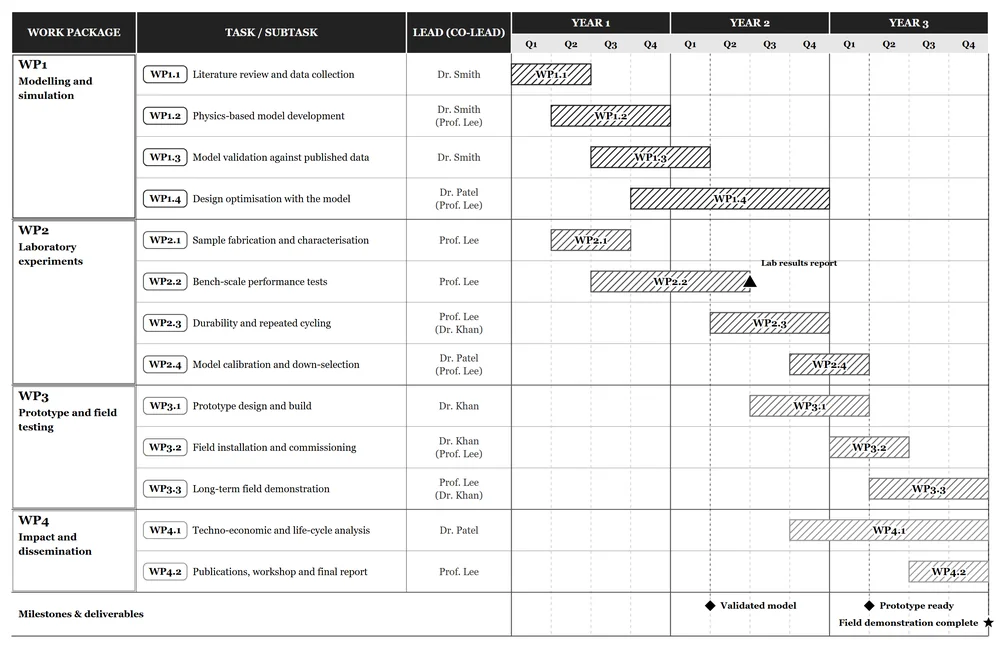
Black and white hatched Gantt chart suitable for printing
Print (black and white)Black and white for printing

About the Gantt Chart Maker

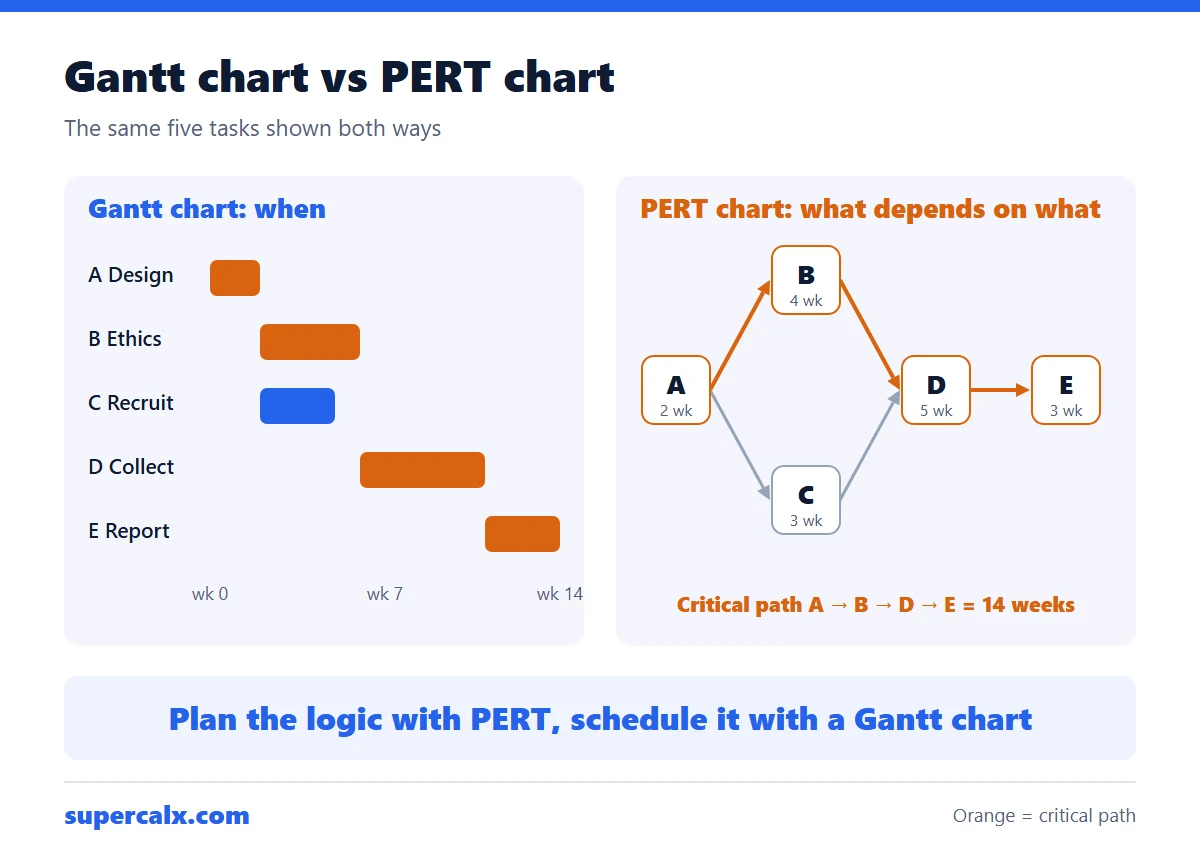
A Gantt chart shows each task as a bar on a timeline, so readers see at a glance what happens when, who leads it and how the pieces overlap. This maker is built for research proposals and project plans: paste the work-package table you already have, and it lays out groups, tasks, leads and milestones for you. Everything runs in your browser, so your plan is never uploaded.

Who it is for

Researchers writing grant proposals, PhD students, project managers, engineers, consultants and anyone who needs a clear timeline for a report or slide.

What you can do

Generate from text or start blank, drag bars and milestones, set leads and co-leads, link dependent tasks, show progress, and switch between 16 styles.

What you get

A sharp PNG or JPG up to 4× resolution, a vector SVG, a print-ready PDF, a CSV for Excel, a project file and a share link.

Tip for proposals: keep the work-package codes (WP1, WP1.1) in your text. The maker groups tasks by their code, colours each work package, and uses the codes as bar labels, which keeps the chart compact and easy to match with your narrative.

Gantt Chart Maker: the short answer

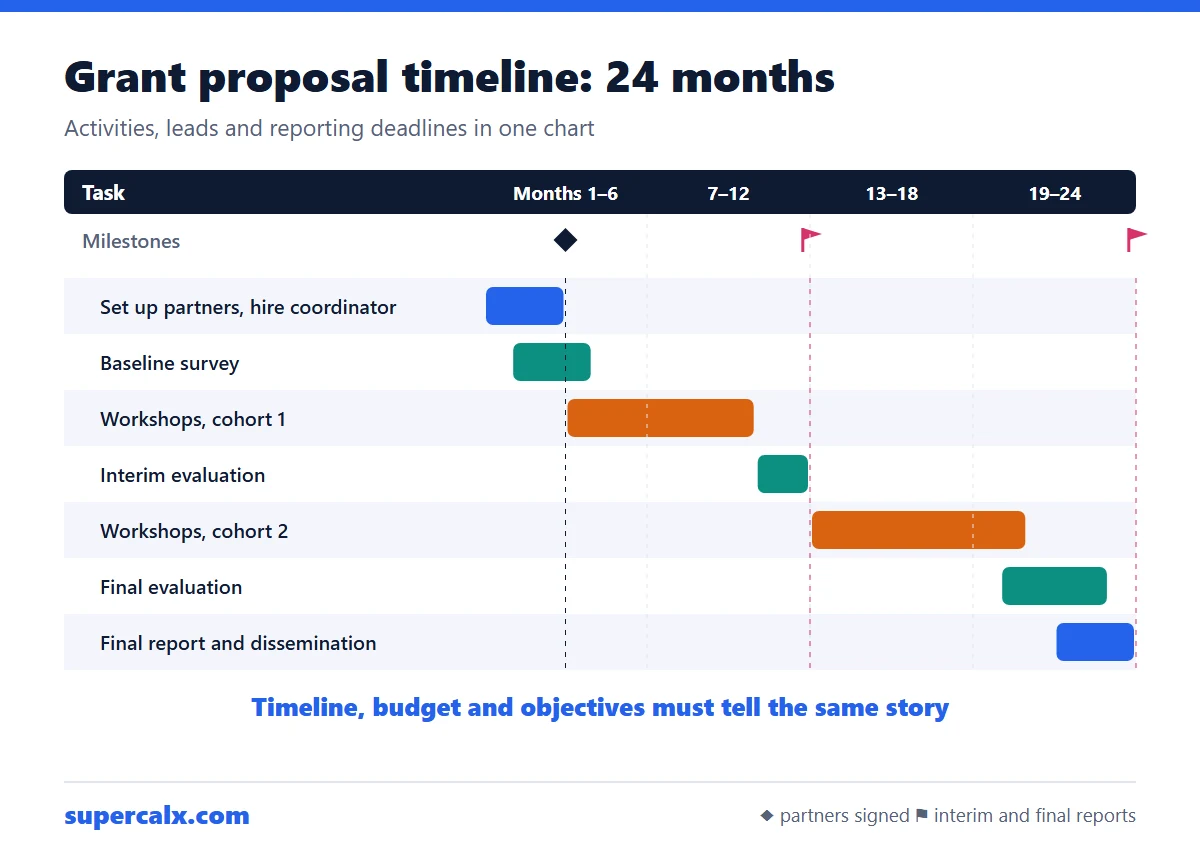
A Gantt chart lists tasks down the side and draws each one as a bar along a timeline, so you can see when work starts, how long it runs and what overlaps. To make one here, paste your plan with a time for each task (for example "WP1.1 Literature review | Dr. Smith | Y1 Q1-Q2") or start from scratch, then drag the bars into place and download the chart.

  • Each bar runs from the task start to its end; longer bars mean longer tasks.
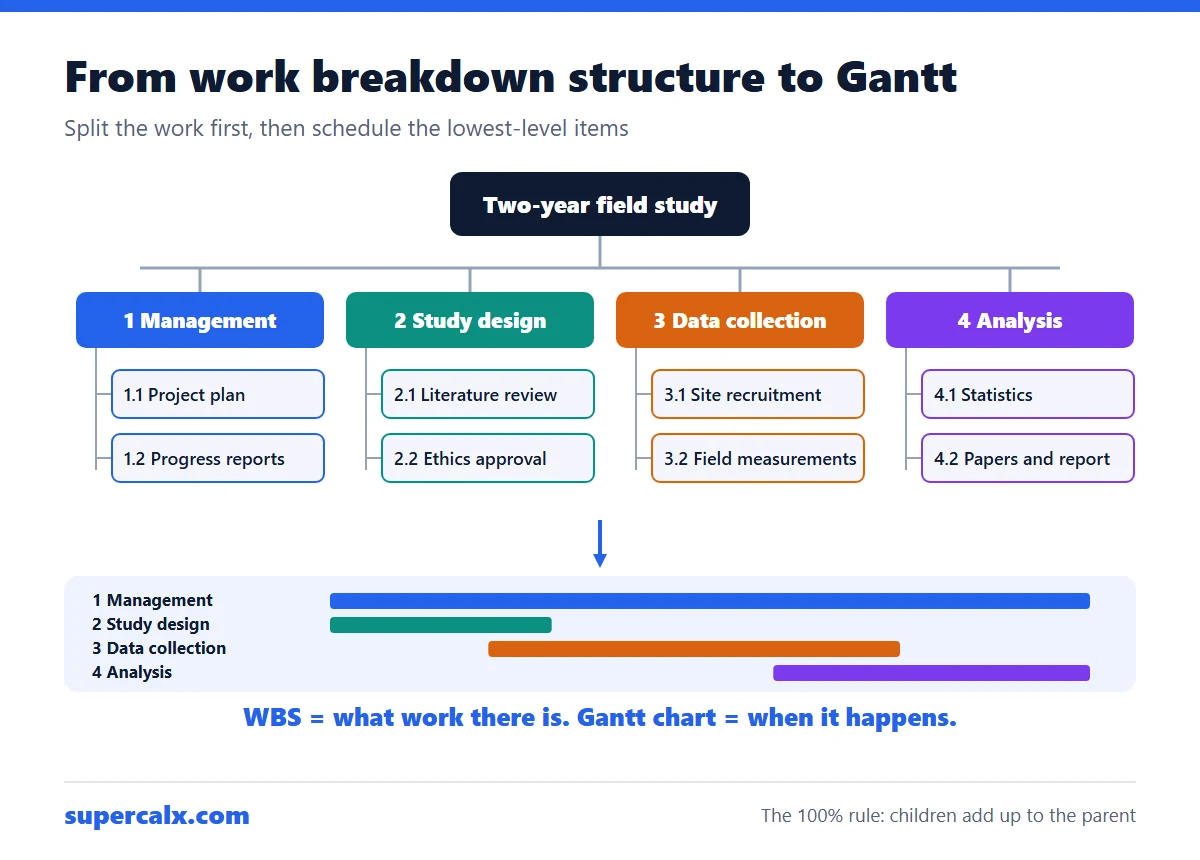
  • Group tasks into work packages or phases so readers can follow the structure.
  • Milestones are points in time (diamonds), not tasks; use them for decisions, reviews and deliverables.
  • Most funders expect quarters for multi-year proposals and months for projects under two years.

By the SuperCalX team · Reviewed by Dr. Ahmed Mortuza Saleque, founder and editor · Last reviewed · How we check our calculators

Time formats the maker understands

You writeIt means
Y1 Q1-Q2Year 1, first two quarters (months 1 to 6)
Y1 Q3 - Y2 Q1From quarter 3 of year 1 to quarter 1 of year 2
M4-M9Months 4 to 9 of the project
Jan-Jun 2027January to June 2027 (calendar dates)
2027-03-01 to 2027-05-15Exact dates
Q3 2027One calendar quarter
6 monthsSix months, starting when the previous task ends

How to build a Gantt chart for a research proposal

  • List your work packages (WP1, WP2…) and the tasks in each, with a lead and co-lead.
  • Give every task a start and end in project years and quarters, so the plan does not depend on the award date.
  • Overlap tasks where the work really runs in parallel; reviewers look for a realistic, not purely sequential, plan.
  • Add milestones for decision points and deliverables for reports, prototypes and data sets.
  • Link tasks that depend on each other and check nothing starts before its input is ready.
  • Keep the chart to one page; use codes on the bars and full names in the table.

Which style to choose

UseStyle
Grant proposal or reportResearch proposal, Forest, Earth tones
Printed in black and whitePrint (black and white)
Slides on a dark backgroundMidnight (dark) or Blueprint
Product or software roadmapRoadmap, Startup bright, Swimlanes
Long plan on one pageCompact one-page
Client or board reportCorporate navy, Classic project

Worked examples

Three-year proposal with four work packages

  1. Paste the work-package table, one task per line: code, name, lead and time.
  2. The maker groups tasks by code (WP1.1 goes under WP1) and colours each package.
  3. Drag WP2.3 one quarter later and stretch WP4.1 to the end of year 3.
  4. Add a milestone "Prototype ready | Y3 Q1" and download a 3× PNG for the proposal.

A one-page work plan chart with leads, coloured work packages and milestones, ready for Word.

Common mistakes

  • Packing every task end to end, which hides real overlap and makes the plan look unrealistic.
  • Using calendar dates in a proposal whose start date is not fixed; use Year 1, Year 2 instead.
  • Too many tiny tasks; merge anything shorter than a month into its parent task.
  • Forgetting milestones, so reviewers cannot see when results are delivered.

Gantt Chart Maker FAQ

Is this Gantt chart maker free?

Yes. There is no sign-up, no watermark and no limit on charts or downloads.

Is my project plan uploaded anywhere?

No. The chart is built in your browser and saved only in this browser. Share links carry the plan inside the link itself.

Can I paste a table from Word or Excel?

Yes. Copied table rows arrive as tab-separated text, which the maker reads as columns: code and task, lead, and start and end.

How do I change the timeline?

Drag a bar to move it, drag either end to make it shorter or longer, or drag across an empty part of a row to redraw the bar. You can also pick start and end from the task table.

Which download should I use for a Word document or grant proposal?

Use PNG at print quality (3×). For journals or posters that ask for vector graphics, use SVG or PDF.

Can I keep editing later?

Your chart is saved in this browser automatically. Use Save project to keep a file you can open again on any computer.

Add this calculator to your website

Teachers, bloggers and businesses can show the Gantt Chart Maker on their own pages for free. Copy this code and paste it into your page's HTML:

Please keep the credit link so readers can find the formula, worked examples and guide.