
Work Breakdown Structure Example: From WBS to Gantt Chart
By Dr. Ahmed Mortuza Saleque · Updated · How we check our content
The short answer
A work breakdown structure (WBS) splits a project into deliverables and smaller pieces of work until each piece can be estimated and assigned. Number them like 1, 1.1, 1.1.1. The WBS says what must be done; a Gantt chart then says when. In practice, the top WBS level becomes your phases or work packages and the lowest level becomes the bars on the Gantt chart.
Open the Gantt Chart Maker →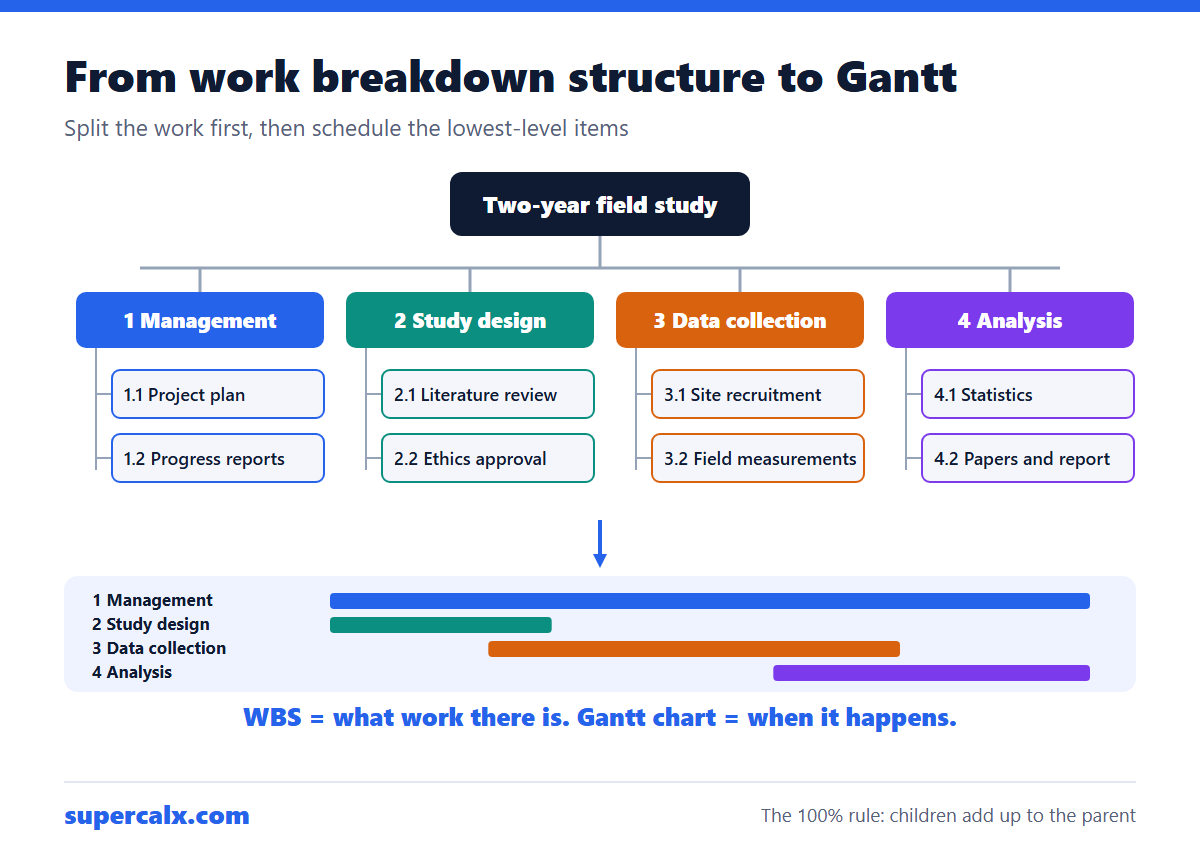
Example WBS: a two-year field study
| Code | Work package or task | Output |
|---|---|---|
| 1 | Project management | Plan, reports |
| 1.1 | Kick-off and project plan | Project plan |
| 1.2 | Progress reports | Reports every 6 months |
| 2 | Study design | Approved protocol |
| 2.1 | Literature review | Review chapter |
| 2.2 | Protocol and ethics application | Ethics approval |
| 3 | Data collection | Clean dataset |
| 3.1 | Site recruitment | Signed site agreements |
| 3.2 | Field measurements | Raw data |
| 4 | Analysis and dissemination | Papers, final report |
| 4.1 | Statistical analysis | Results tables |
| 4.2 | Papers and final report | Two papers, report |
Rules for a good WBS
- The 100% rule: the children of each item add up to all of its work, and nothing outside the project appears.
- Name items as nouns or outcomes (Ethics approval), not vague verbs (Do ethics).
- Stop splitting when a piece can be estimated and owned by one person. A common guide is 8 to 80 hours of effort per lowest-level item.
- Three levels are enough for most proposals and small projects.
- Include project management as its own branch; it takes real time.
To size each lowest-level item, the man-hours calculator converts people and days into effort, and the business budget calculator helps total the cost.
From WBS to Gantt chart
- Give each lowest-level item a duration and a start that respects what it depends on.
- In the Gantt Chart Maker, type each top-level item as a group line with no time: 3 Data collection.
- Type the tasks under it with their times: 3.1 Site recruitment | Co-I | M4-M7.
- Add the outputs from the WBS as Deliverable: lines at their due dates.
- Link tasks that wait on others, then check the chart against the WBS: every lowest-level item should have a bar.
WBS vs Gantt chart
| WBS | Gantt chart | |
|---|---|---|
| Answers | What work is there? | When does it happen? |
| Shape | Tree or outline | Bars on a calendar |
| Time shown | No | Yes |
| Made | First | Second, from the WBS |
Common questions
What is the 100% rule in a WBS?
The work in the children of any item must add up to exactly the work of that item, so nothing is missed and nothing extra is included.
How many levels should a WBS have?
Usually three: project, work packages and tasks. Large engineering programmes go deeper.
Is a WBS the same as a Gantt chart?
No. A WBS lists the work without dates; a Gantt chart schedules that work over time.
Can I make a WBS in Excel?
Yes, as an indented list with codes. Paste the same rows into the Gantt Chart Maker, add times, and you have the schedule.
Calculators for this article
More from the blog
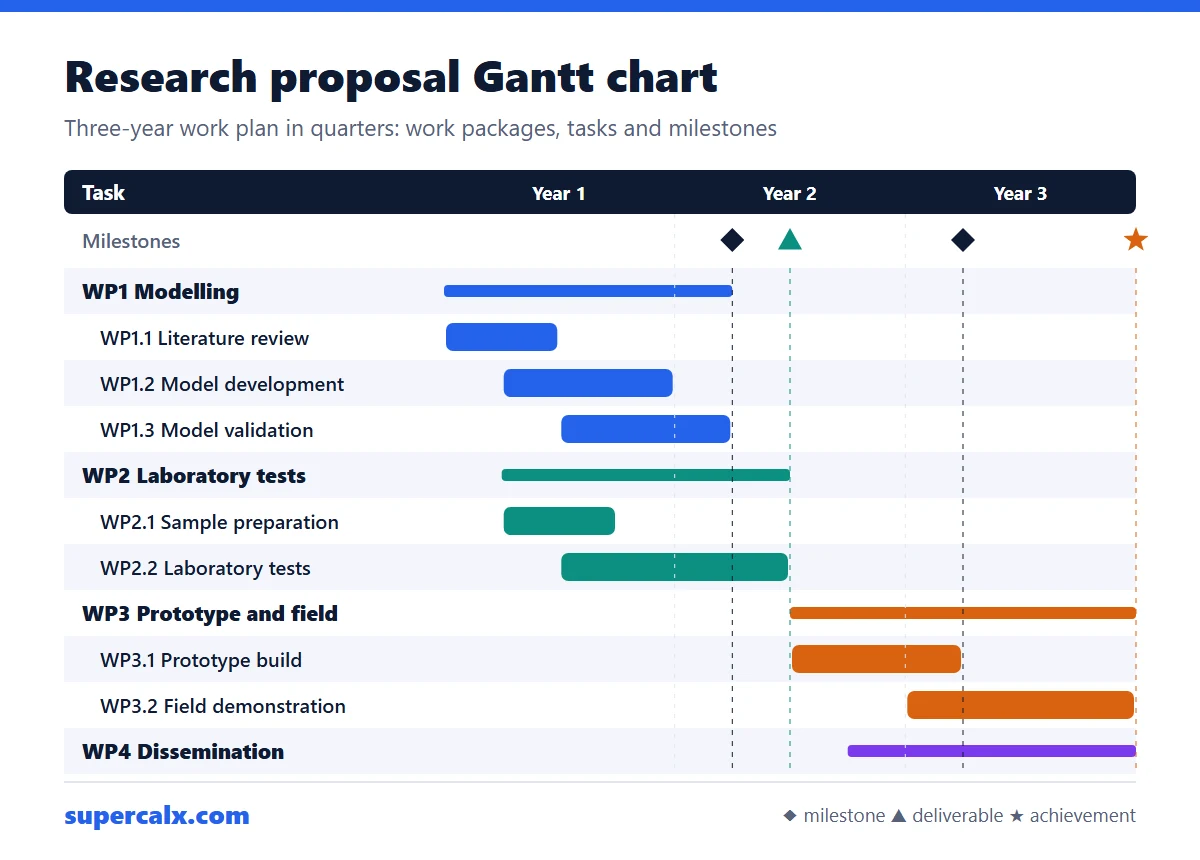 Gantt Chart for a Research Proposal: Example and Template
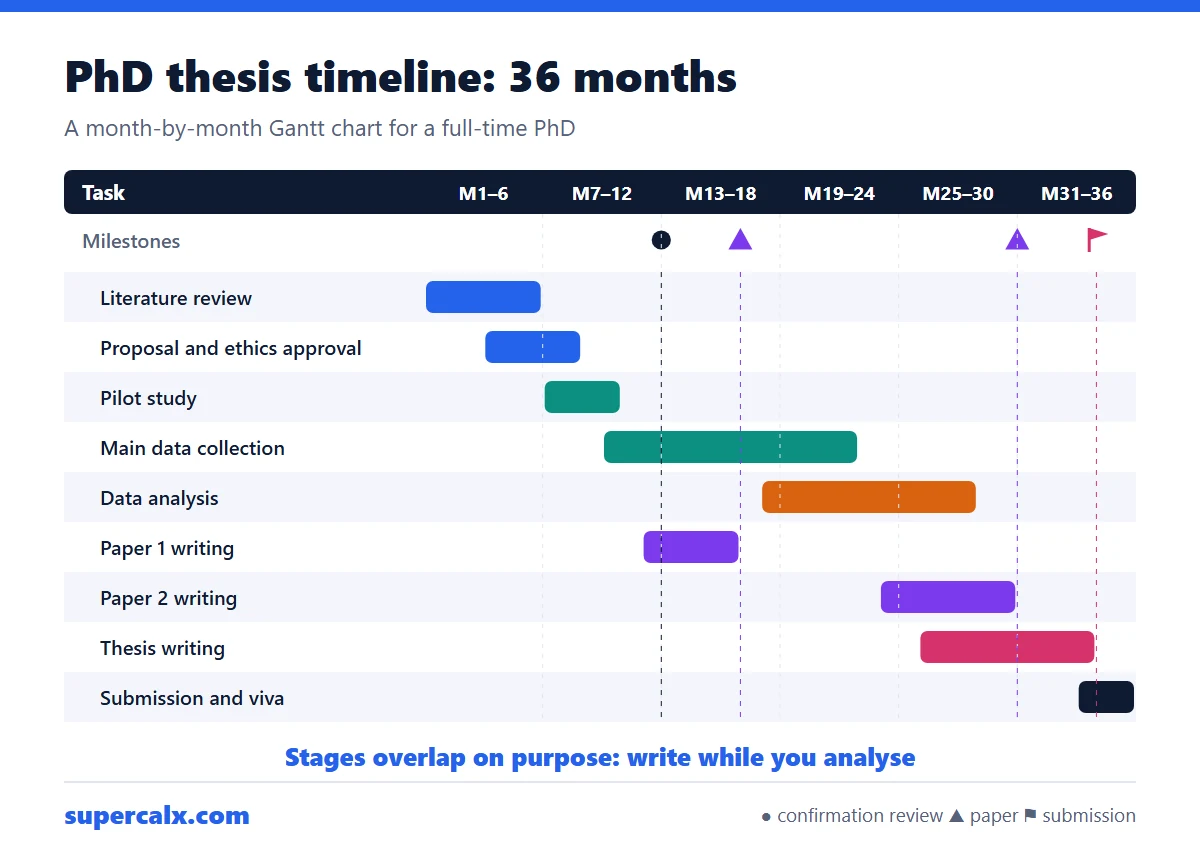 PhD and Thesis Gantt Chart: Timeline Example by Month
 Gantt Chart Milestones and Deliverables: How to Show Them
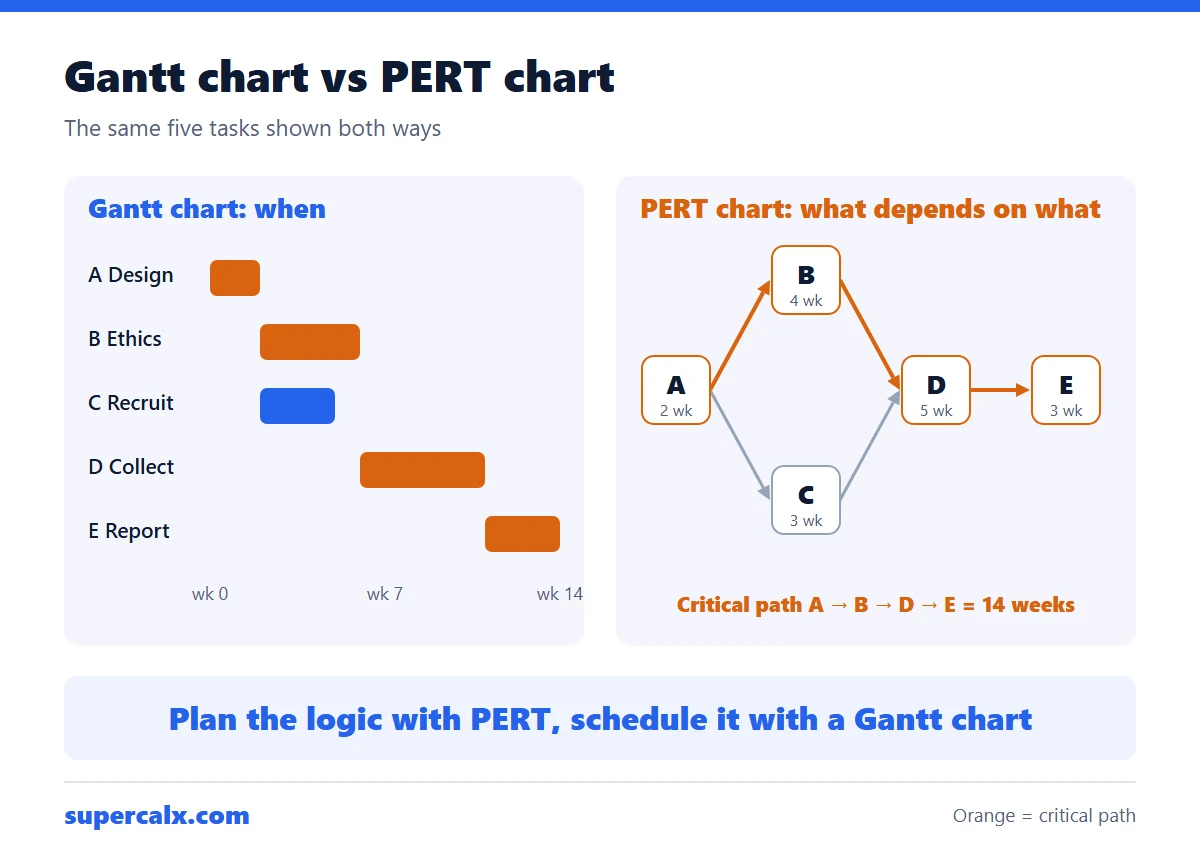 Gantt Chart vs PERT Chart vs Timeline: Which to Use
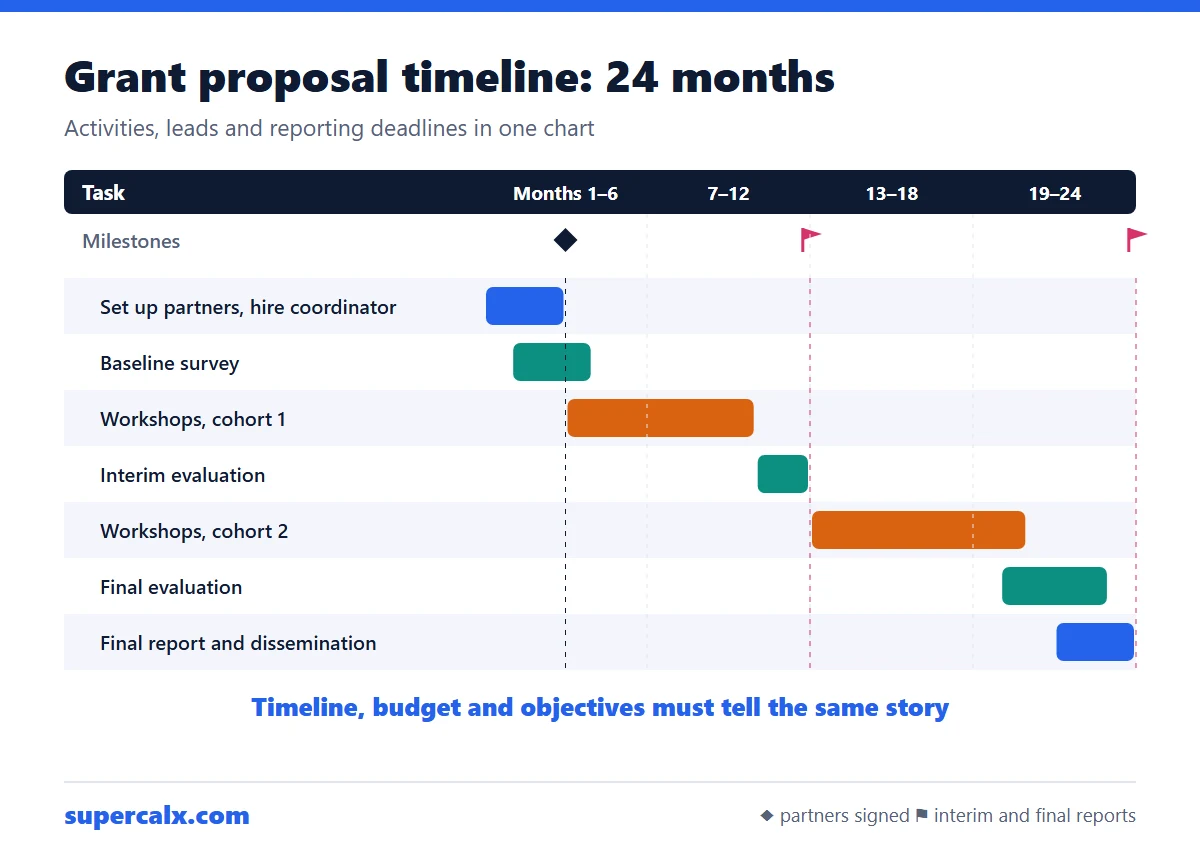 How to Write a Grant Proposal Timeline (With Example)
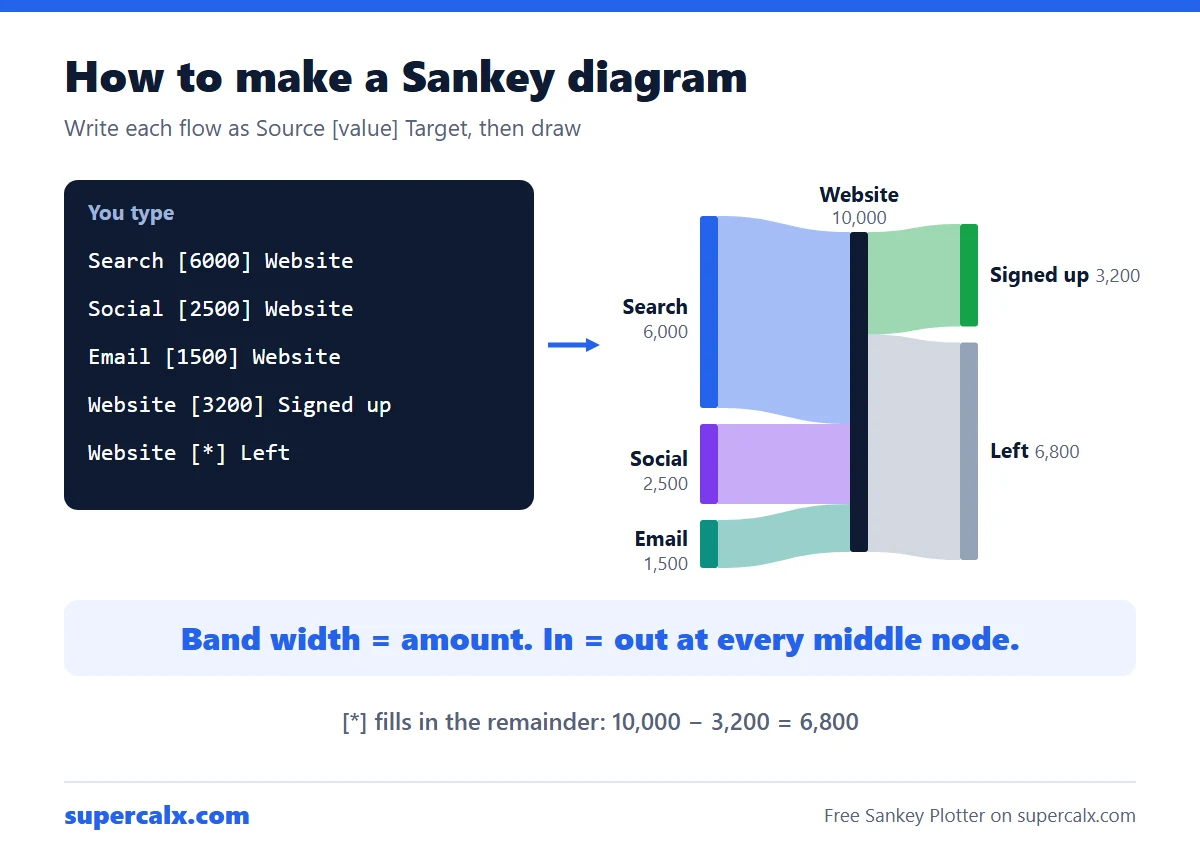 How to Make a Sankey Diagram (Free, No Excel Add-in)
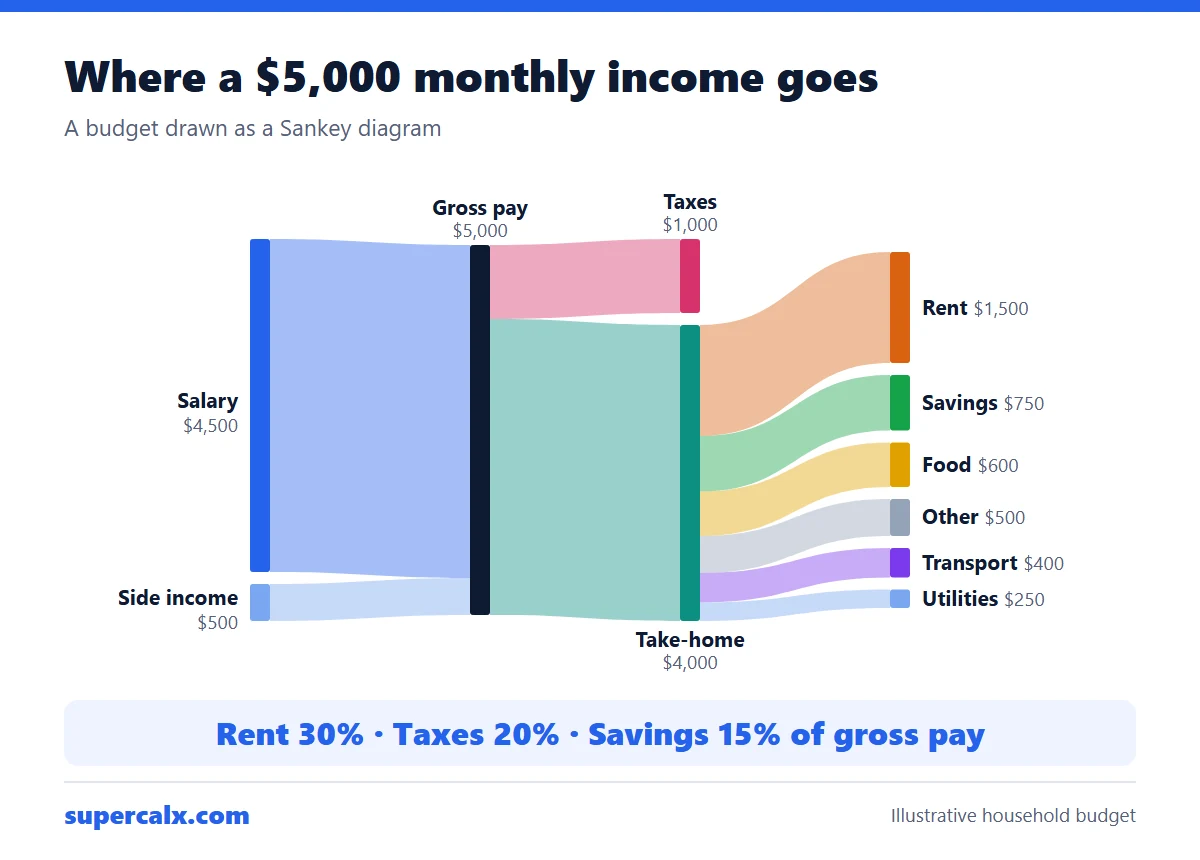 Sankey Diagram for a Budget: See Where Your Money Goes
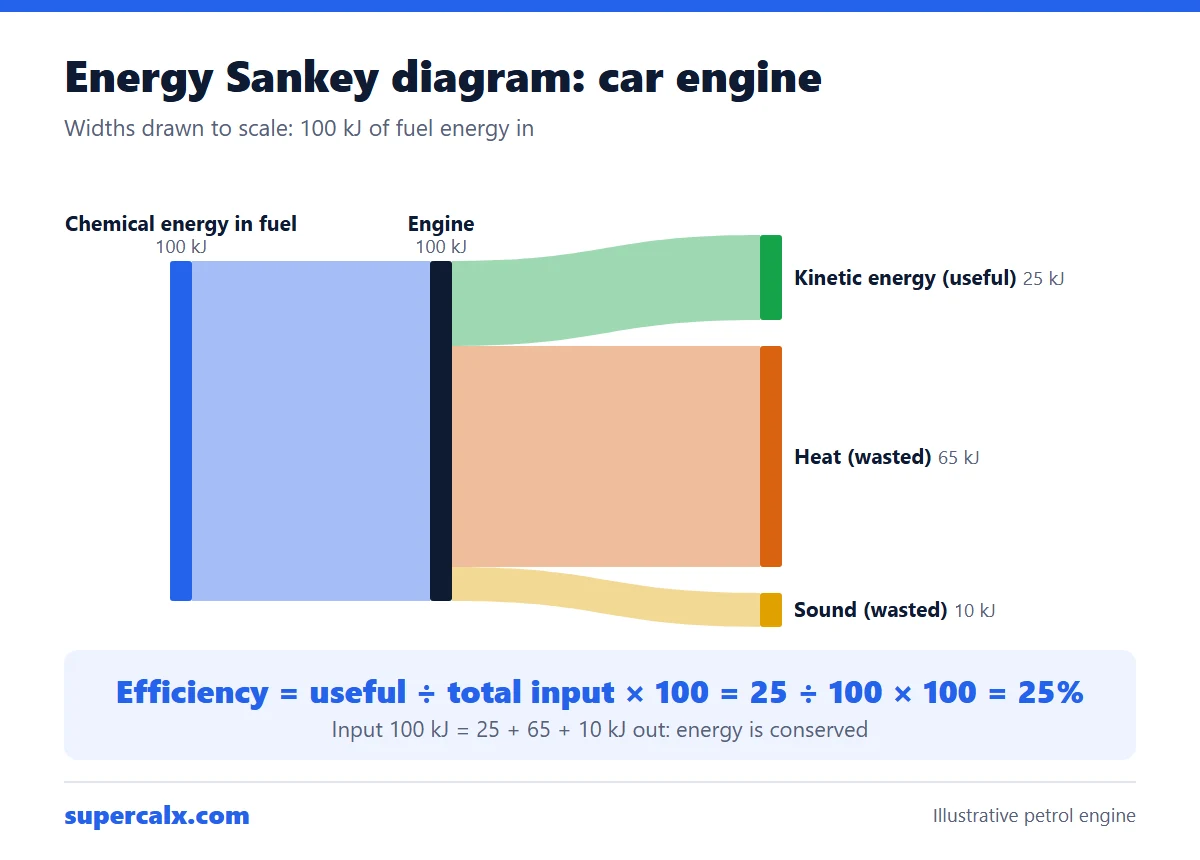 Energy Sankey Diagram: How to Draw One and Find Efficiency