Step-by-step explanations of the calculations people ask about most. Each article gives the short answer first, shows the working with real numbers and a chart, and links to the calculator that does it for you.
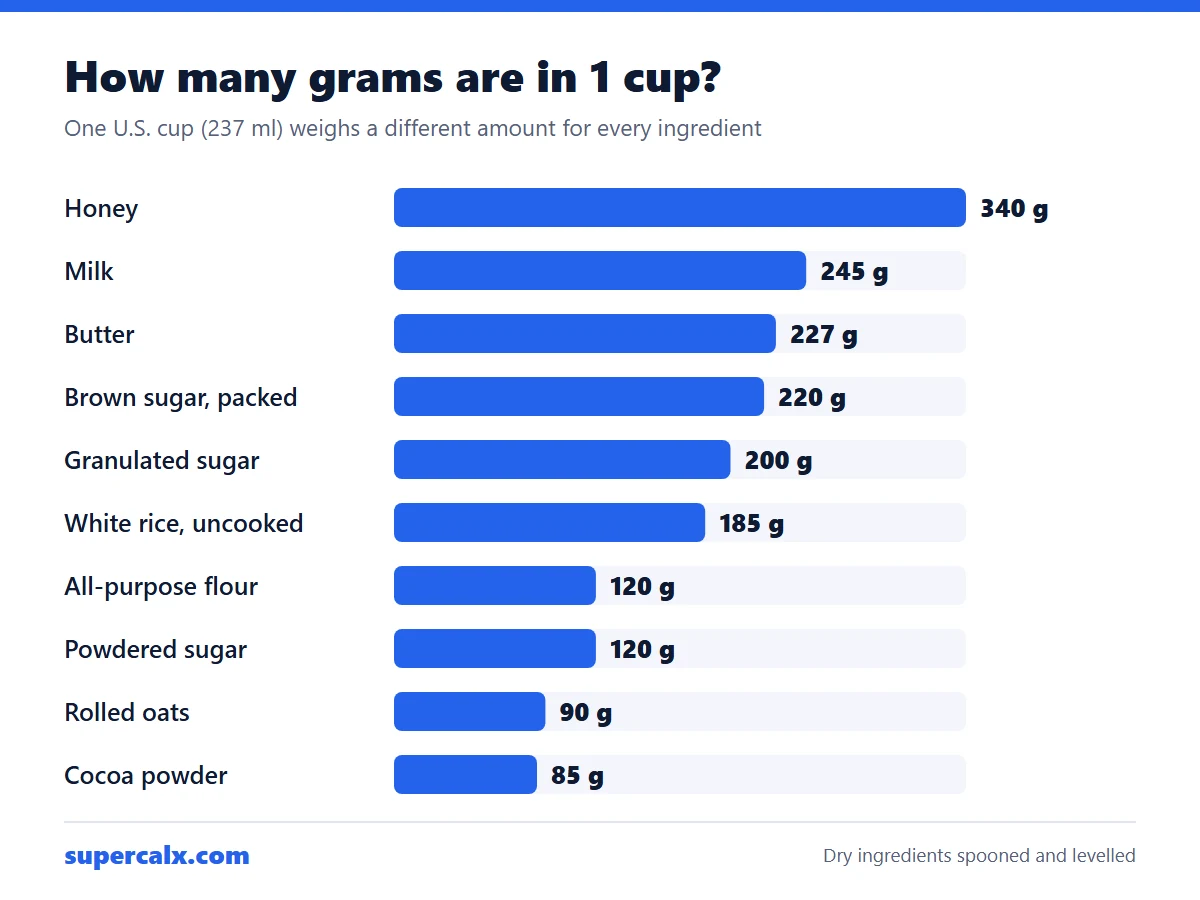
There is no single grams-to-cups number, because a cup measures volume and grams measure weight. One U.S. cup holds about 120 g of all-purpose flour, 200 g of granulated sugar or 227 g of butter. To convert, divide the grams by the ingredient's weight per cup: 250 g of flour is about 2.1 cups, but 250 g of sugar is 1.25 cups.
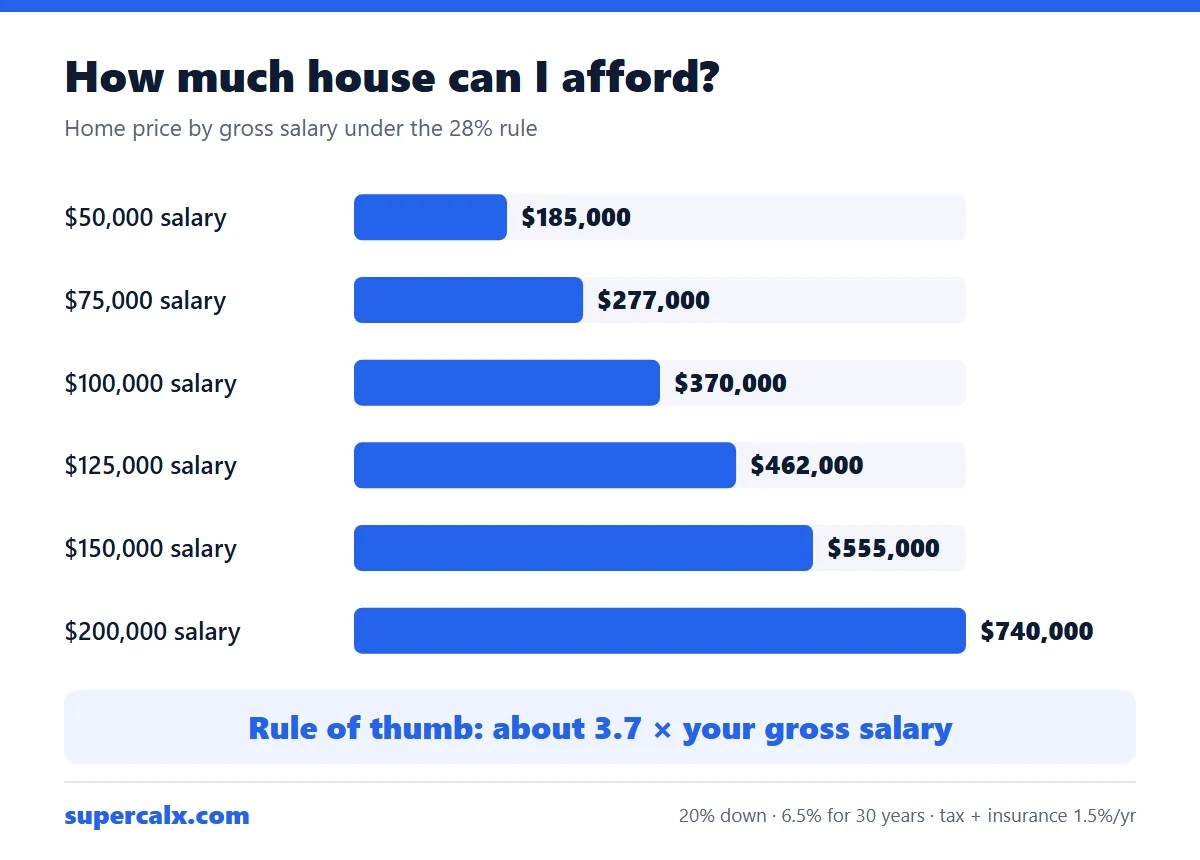
A common lender rule caps housing costs at 28% of gross monthly income. On a $100,000 salary that is $2,333 a month, which supports a home of about $370,000 with 20% down at 6.5% for 30 years, once property tax and insurance are included. Other debts, a smaller down payment or a higher rate all lower the figure.
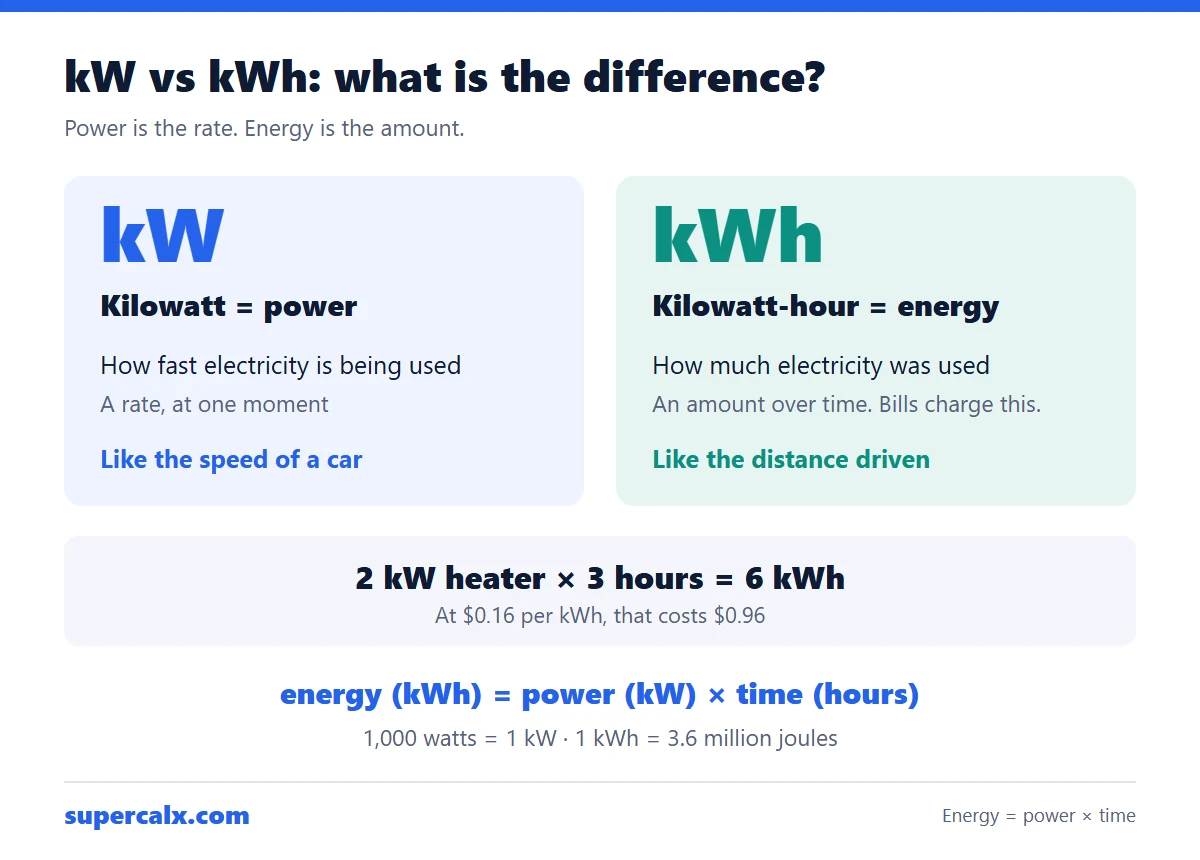
A kilowatt (kW) measures power: how fast electricity is being used at one moment. A kilowatt-hour (kWh) measures energy: how much was used over time. Energy = power × time, so a 2 kW heater running for 3 hours uses 6 kWh. Your electricity bill charges for kWh, not kW.
Take-home pay = gross pay − federal income tax − Social Security (6.2%) − Medicare (1.45%) − state tax − other deductions. A single filer earning $75,000 in 2026 pays about $7,670 in federal income tax and $5,738 in Social Security and Medicare. With a 5% state tax, about $57,843 is left: $4,820 a month.
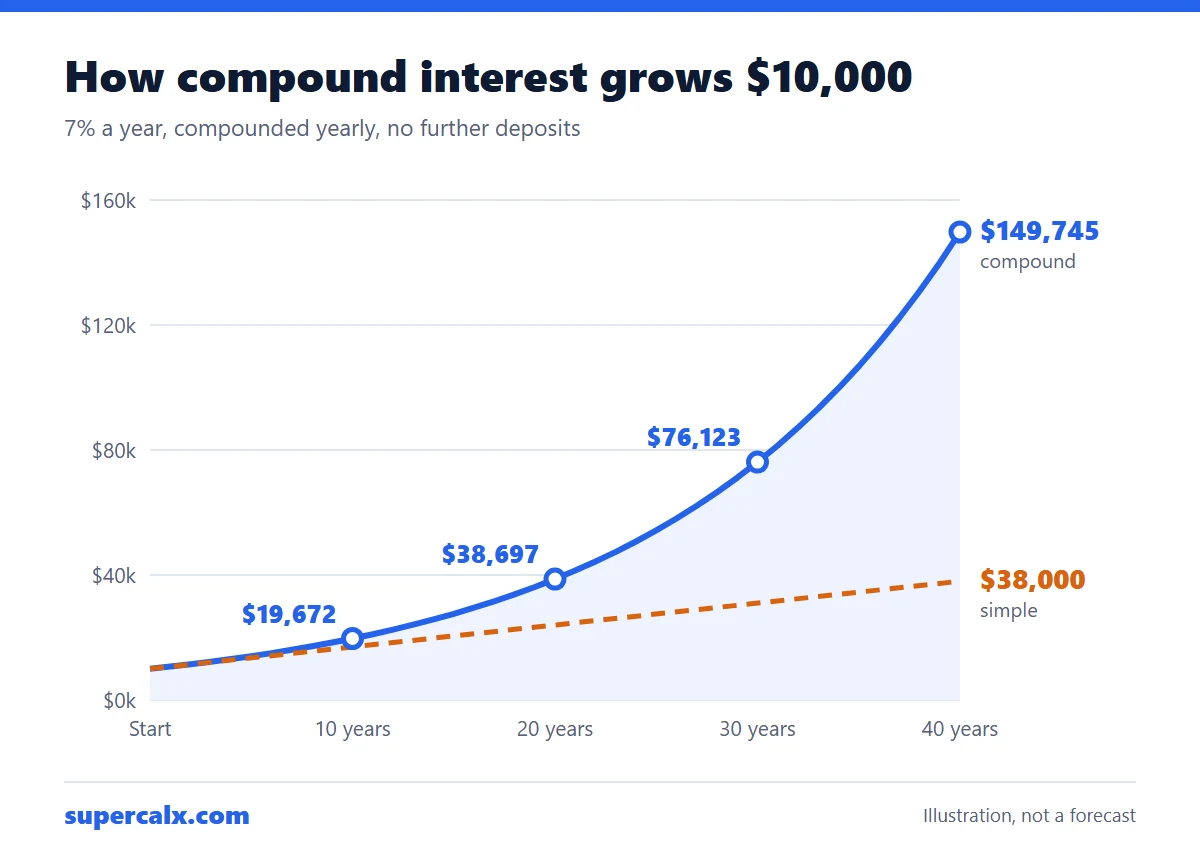
Compound interest is interest earned on both your original money and the interest already added. $10,000 at 7% a year grows to $19,672 after 10 years, $38,697 after 20 and $76,123 after 30. With simple interest it would reach only $31,000 after 30 years. The formula is A = P(1 + r)ᵗ.
Gravel in cubic yards = length (ft) × width (ft) × depth (in) ÷ 12 ÷ 27. A 40 × 10 ft driveway laid 4 inches deep needs 4.94 cubic yards, about 6.9 tons. Add 10% for compaction and uneven ground and order about 5.4 cubic yards, or 7.6 tons.
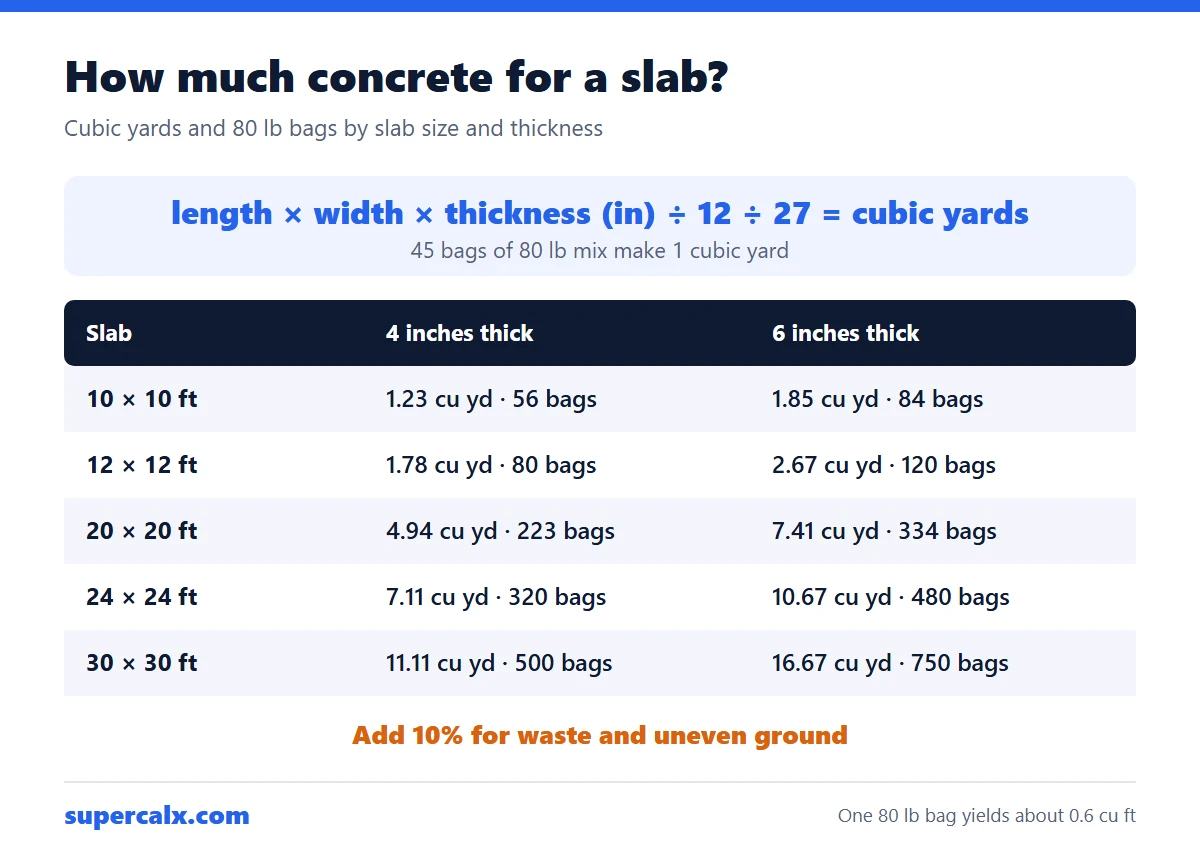
Concrete in cubic yards = length (ft) × width (ft) × thickness (in) ÷ 12 ÷ 27. A 10 × 10 ft slab 4 inches thick needs 33.3 cubic feet, which is 1.23 cubic yards or 56 bags of 80 lb mix. Add 10% for waste and uneven ground and order about 1.4 cubic yards.
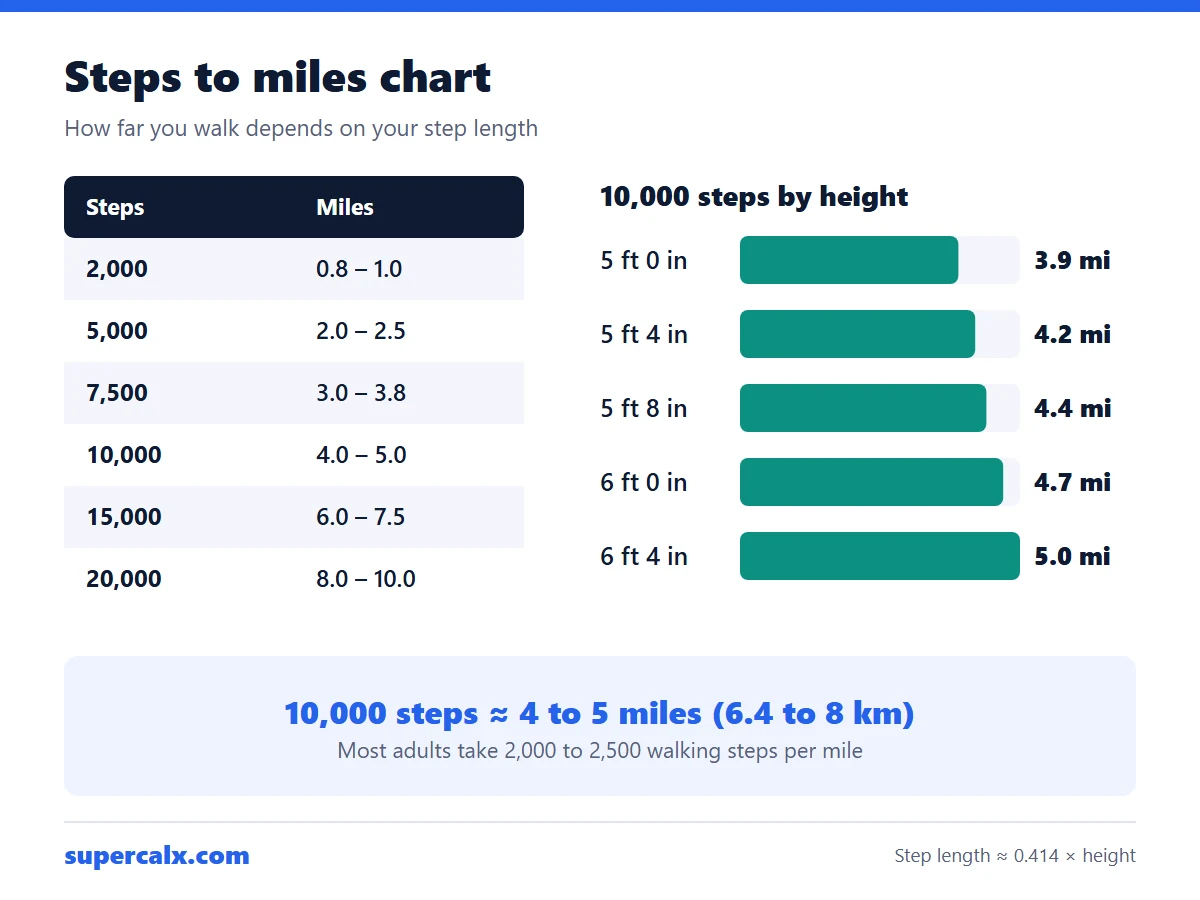
Most adults take 2,000 to 2,500 walking steps per mile, so 10,000 steps is about 4 to 5 miles (6.4 to 8 km). Taller people cover more ground per step: at 5 ft 4 in, 10,000 steps is about 4.2 miles, and at 6 ft it is about 4.7 miles.
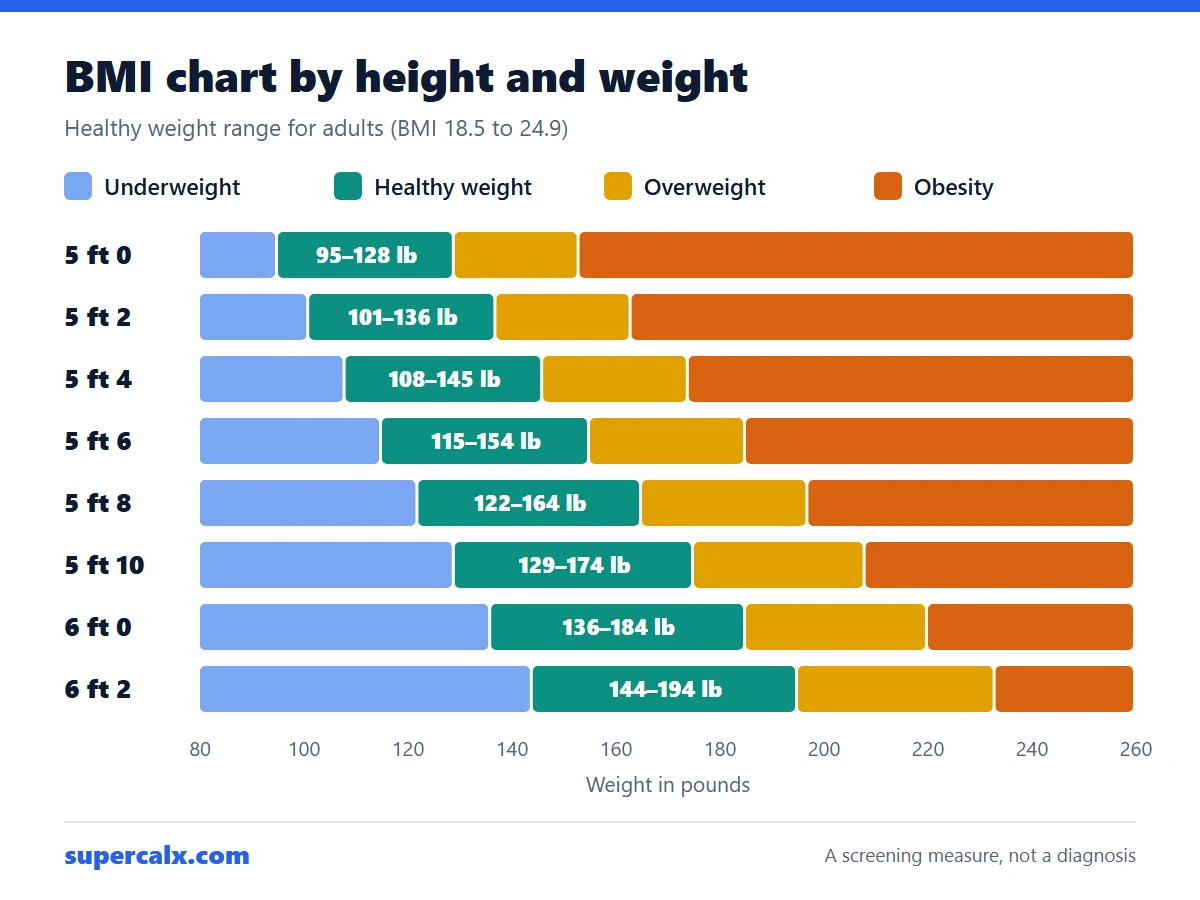
BMI is weight divided by height squared: kg ÷ m², or lb × 703 ÷ in². For adults, 18.5 to 24.9 is the healthy range, 25 to 29.9 is overweight and 30 or more is obesity. At 5 ft 8 in, the healthy range is about 122 to 164 lb (55 to 74 kg).
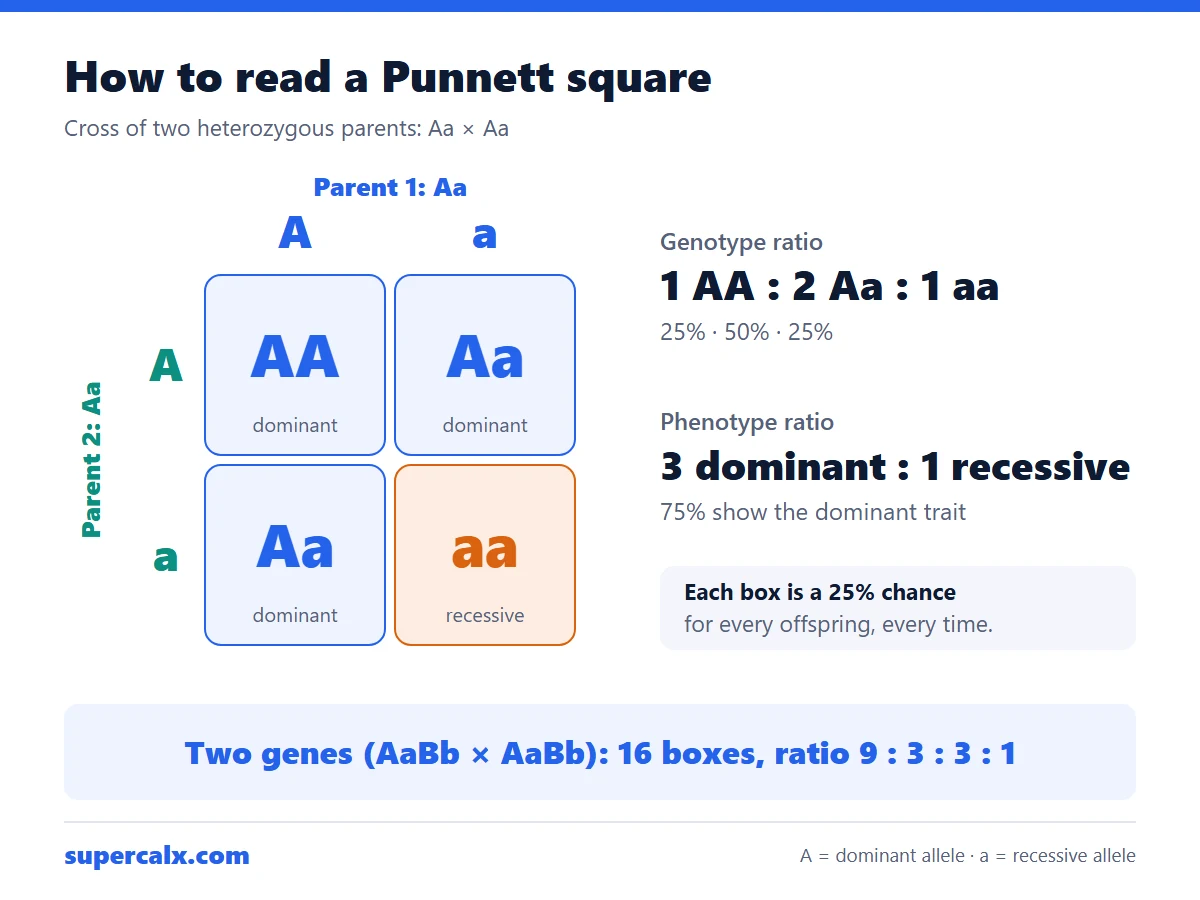
A Punnett square is a grid that shows every way two parents' alleles can combine. Write one parent's alleles across the top and the other's down the side, then fill each box with one letter from each. Crossing Aa × Aa gives 1 AA : 2 Aa : 1 aa, so 3 in 4 offspring show the dominant trait.
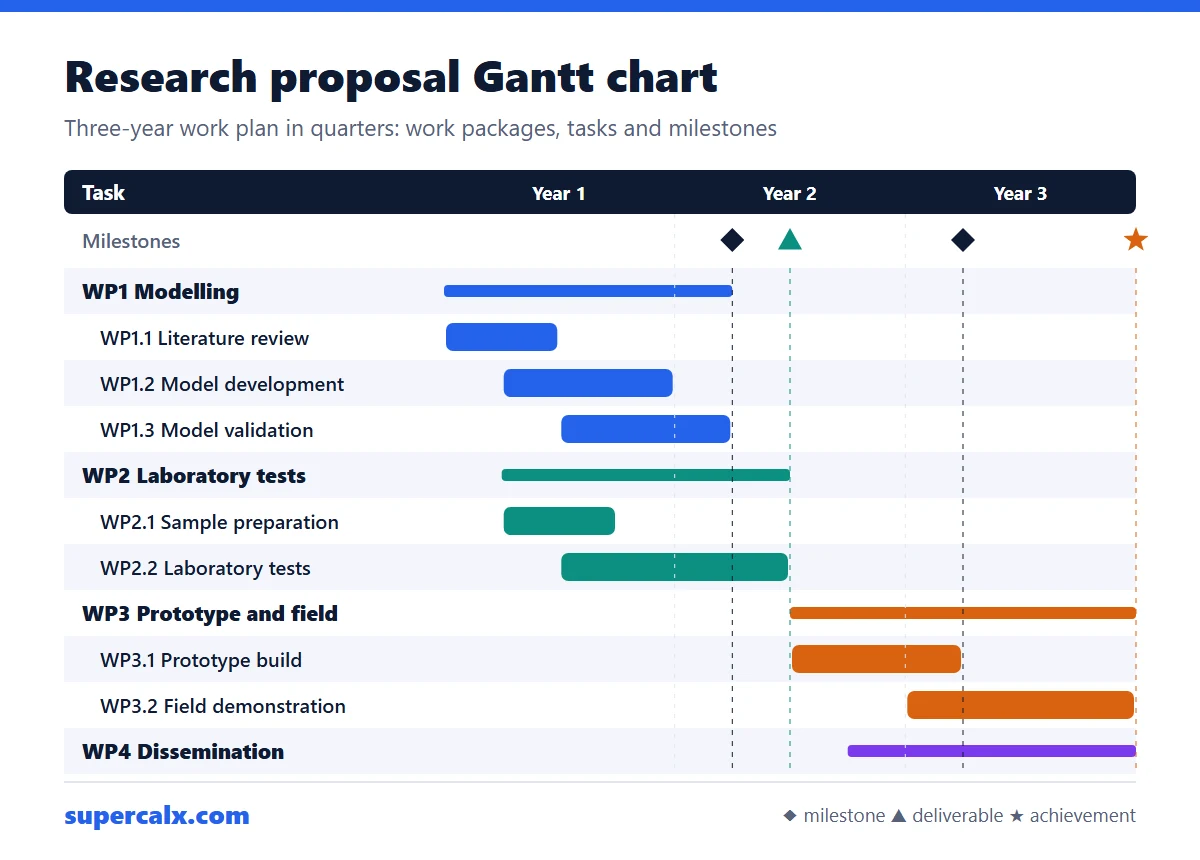
A research proposal Gantt chart lists your work packages and tasks down the left, time across the top in months or quarters, and a bar for when each task runs. Add milestones and deliverables as markers, show who leads each task, and make sure every objective in the proposal has at least one bar. For a 3-year grant, quarters (Y1 Q1 to Y3 Q4) are usually enough.
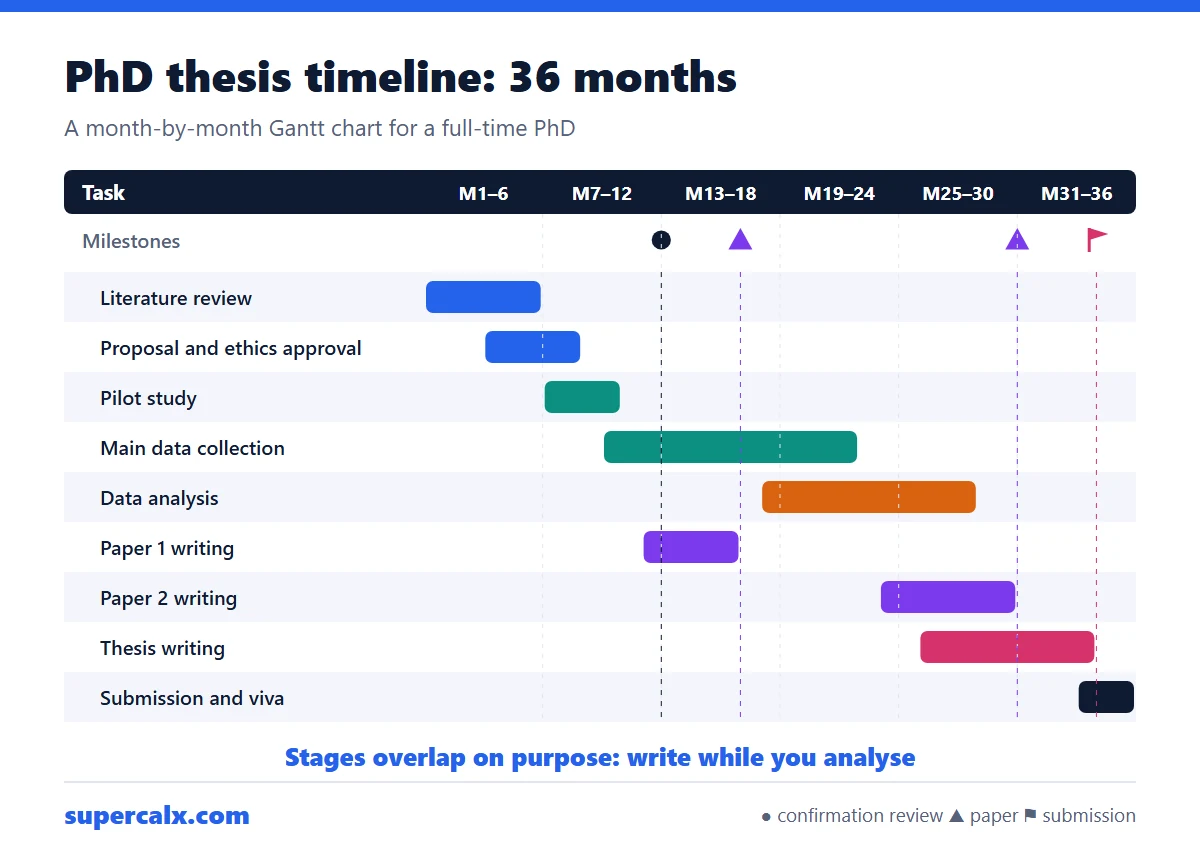
A thesis Gantt chart breaks the degree into overlapping stages: literature review, proposal and ethics, data collection, analysis, papers and writing, then submission. For a 36-month PhD, plan data collection around months 10 to 22 and writing from month 26, and add milestones such as the confirmation review at month 12. For a master thesis, use weeks or months over 4 to 9 months.
A milestone on a Gantt chart is a zero-length marker, usually a diamond, placed at the moment a checkpoint is reached, such as design approved or prototype ready. A deliverable is an output handed to someone, such as a report, often shown as a triangle at its due date. Neither has a bar, because neither takes time: the tasks before them do.
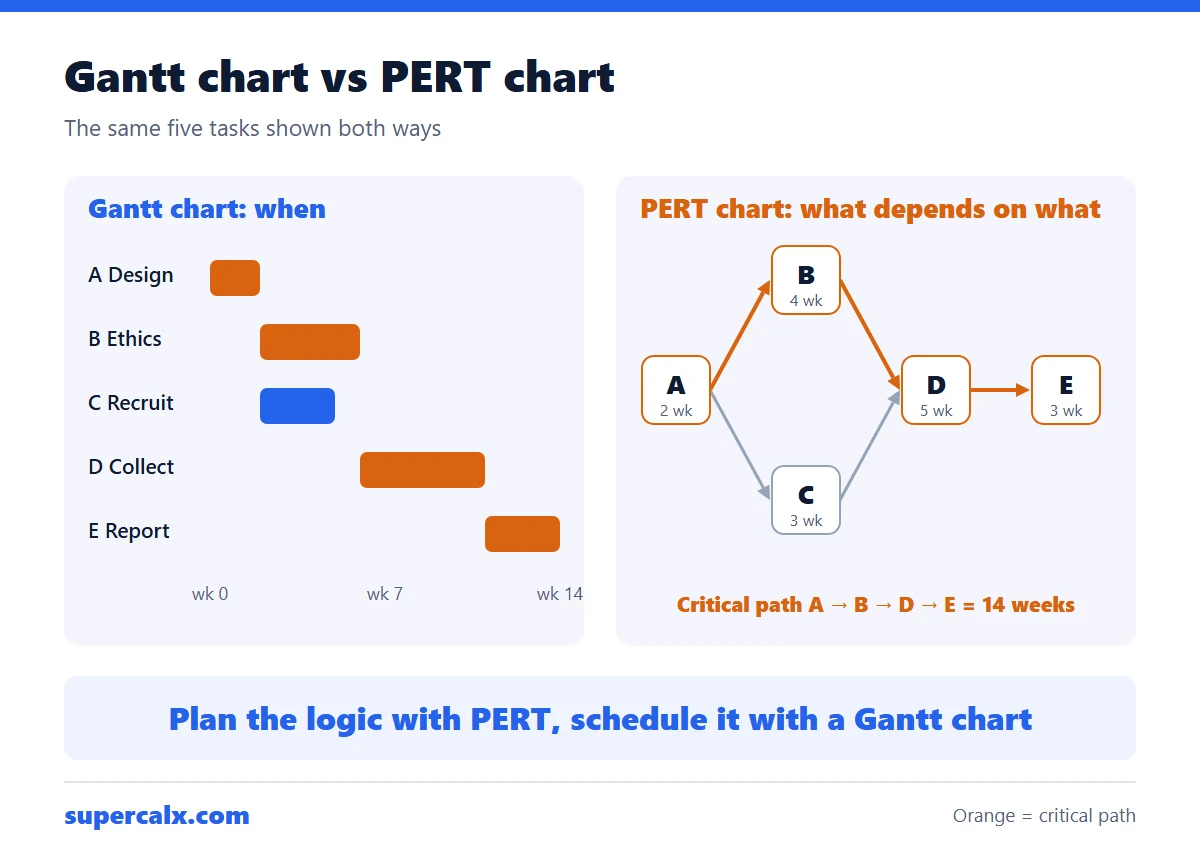
A Gantt chart is a bar chart of tasks against a calendar, so it shows when each task happens and how long it takes. A PERT chart is a network of boxes and arrows that shows which tasks depend on which, and helps find the critical path. A timeline only shows key dates. Use PERT to plan the logic, then a Gantt chart to schedule and communicate it.
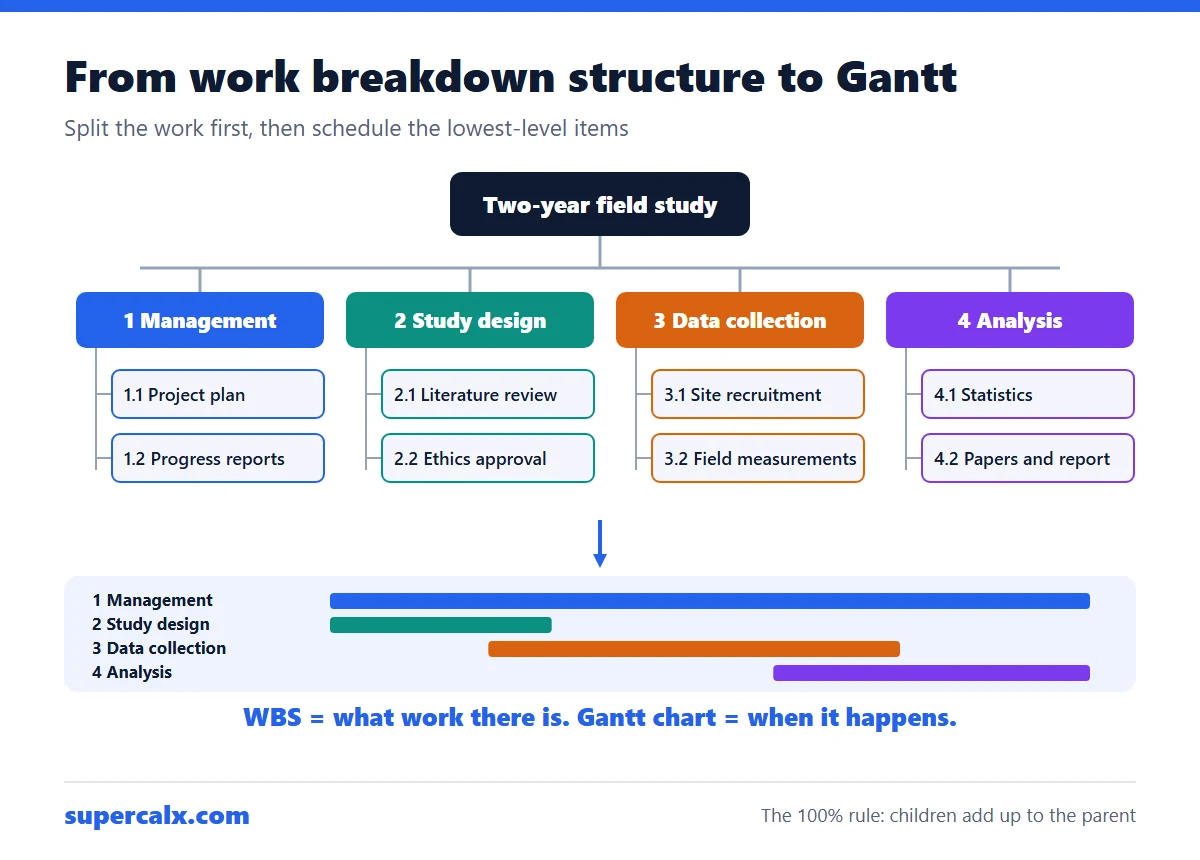
A work breakdown structure (WBS) splits a project into deliverables and smaller pieces of work until each piece can be estimated and assigned. Number them like 1, 1.1, 1.1.1. The WBS says what must be done; a Gantt chart then says when. In practice, the top WBS level becomes your phases or work packages and the lowest level becomes the bars on the Gantt chart.
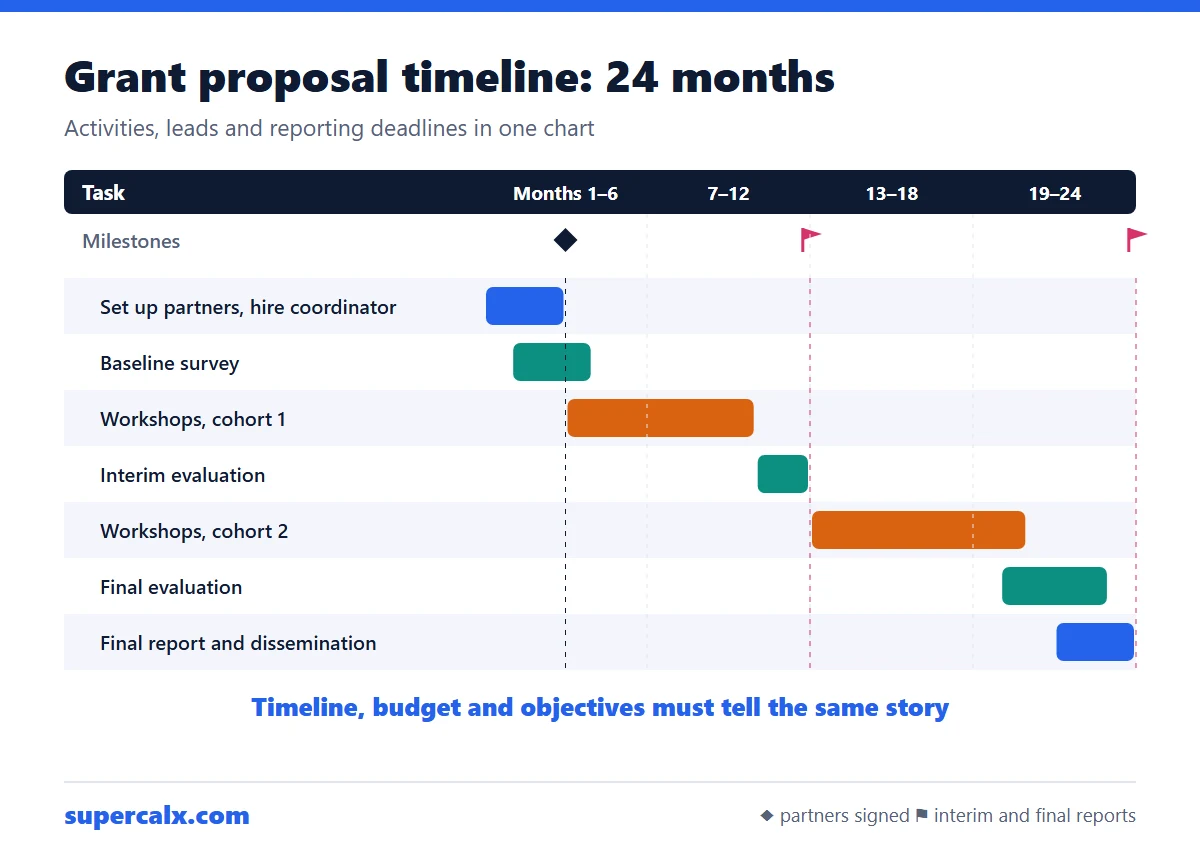
A grant proposal timeline shows when each activity, milestone and deliverable happens during the funded period, usually in months from the award date. Write a short paragraph explaining the phases, then give a table or Gantt chart with each activity, its months, who leads it and what it produces. Make sure the timeline, the budget and the objectives tell the same story.
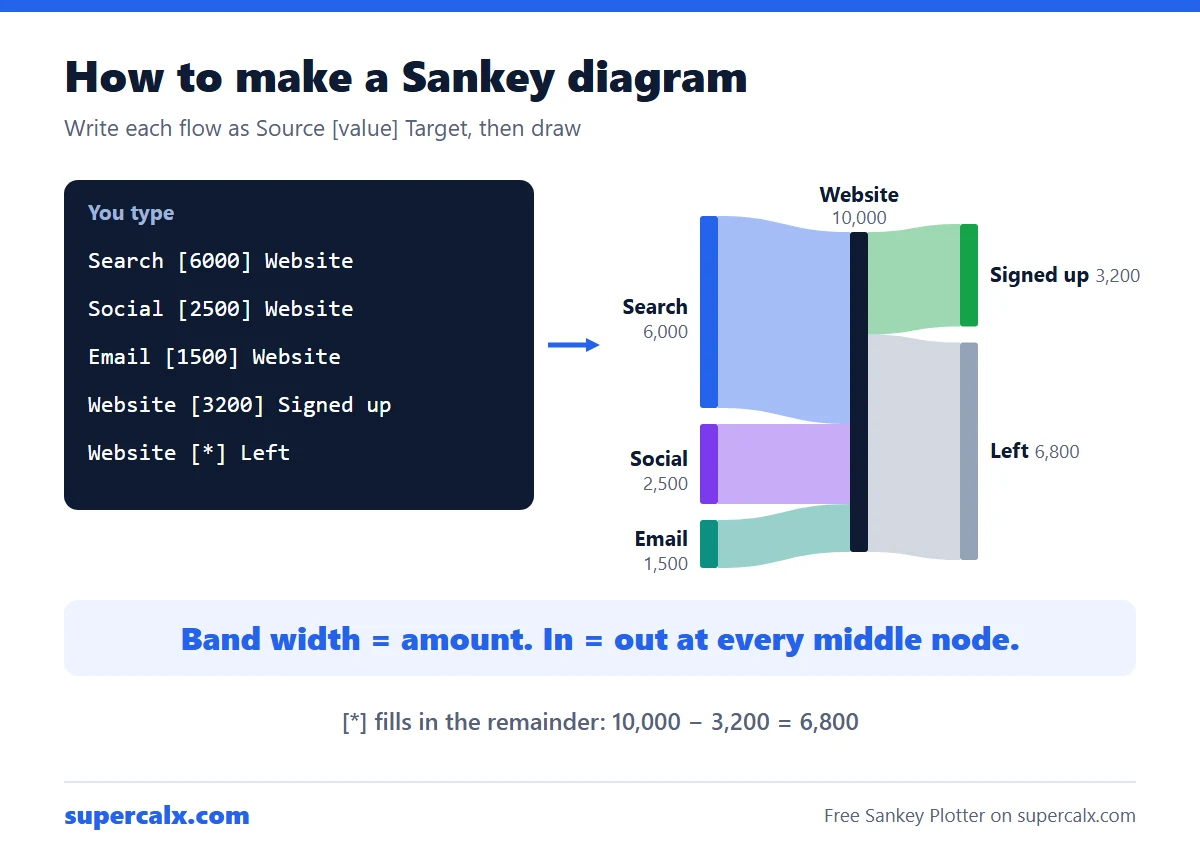
To make a Sankey diagram, list every flow as source, amount and target, for example Salary [4000] Budget, then let a Sankey tool draw a band for each flow with a width proportional to the amount. Check that what flows into each middle node equals what flows out. The free SuperCalX Sankey Plotter draws it in your browser with no add-in or sign-up.
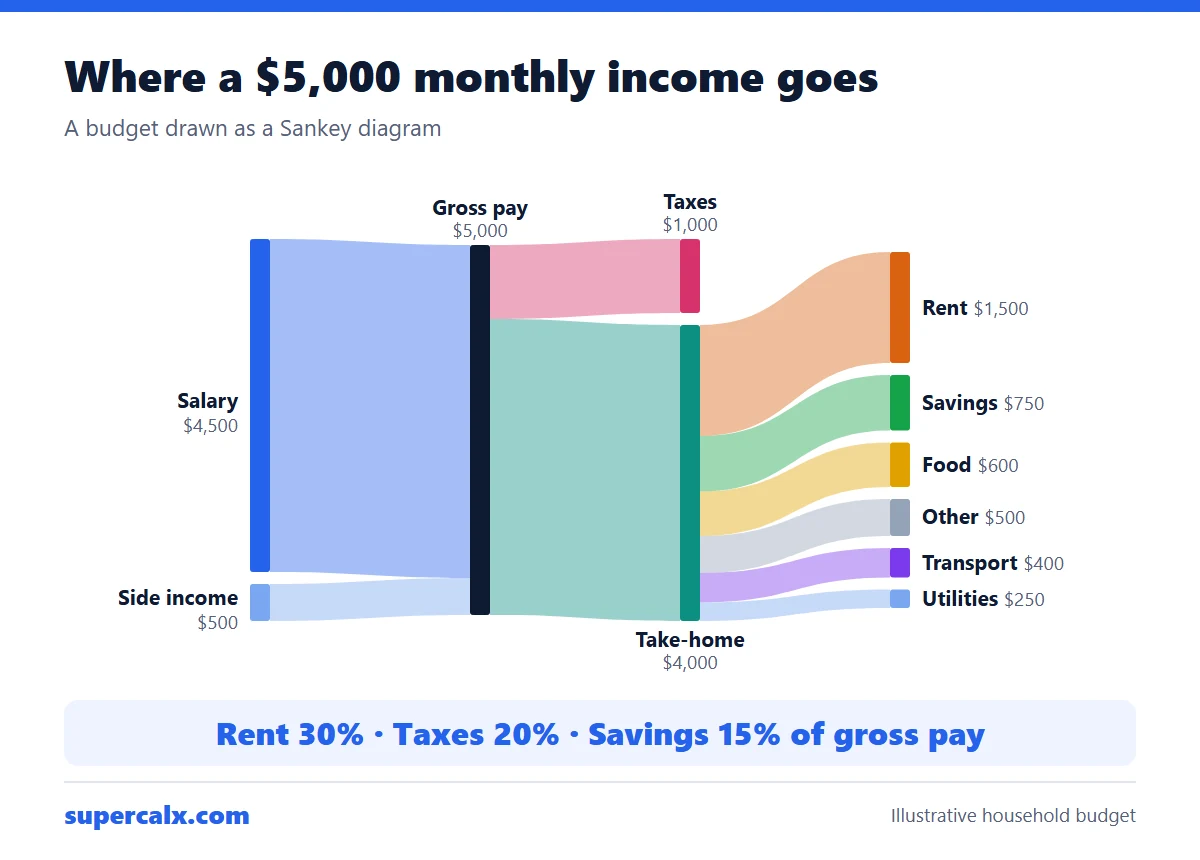
A budget Sankey diagram starts with income on the left and splits it into bands for tax, housing, food, savings and other spending, each as wide as its amount. To make one, write each flow as Source [amount] Target, such as Salary [5000] Gross pay, and paste the lines into a Sankey tool. It shows at a glance which costs take the biggest share.
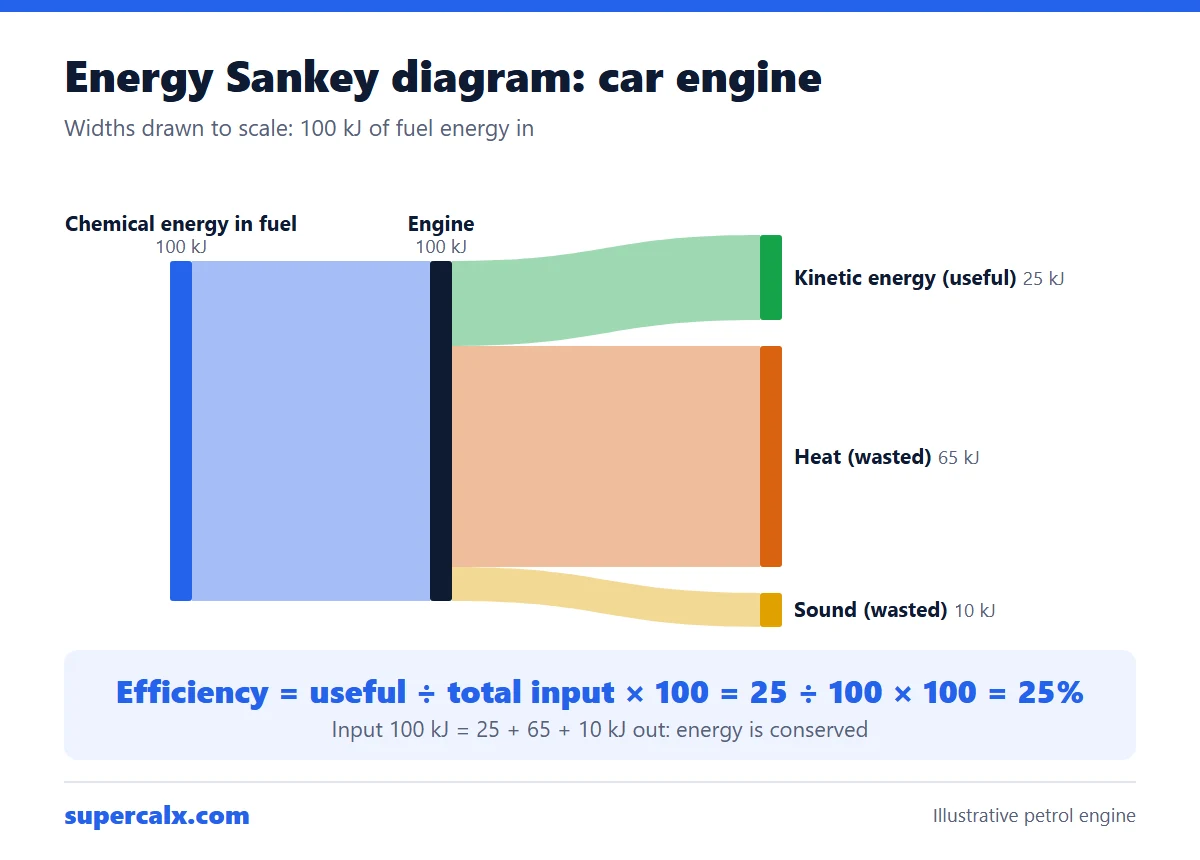
An energy Sankey diagram shows the energy going into a device as one wide arrow that splits into useful and wasted energy, each drawn to scale. The useful arrow points right and the wasted arrows bend away. Efficiency is useful output ÷ total input × 100. A bulb that turns 100 J into 10 J of light and 90 J of heat is 10% efficient.
A Sankey diagram shows how a quantity flows from sources to destinations, with each band as wide as the amount it carries. Use one when something is conserved as it moves through stages: money through a budget, energy through a machine, users through a website, materials through a factory. Avoid it for comparisons over time or when flows do not add up.
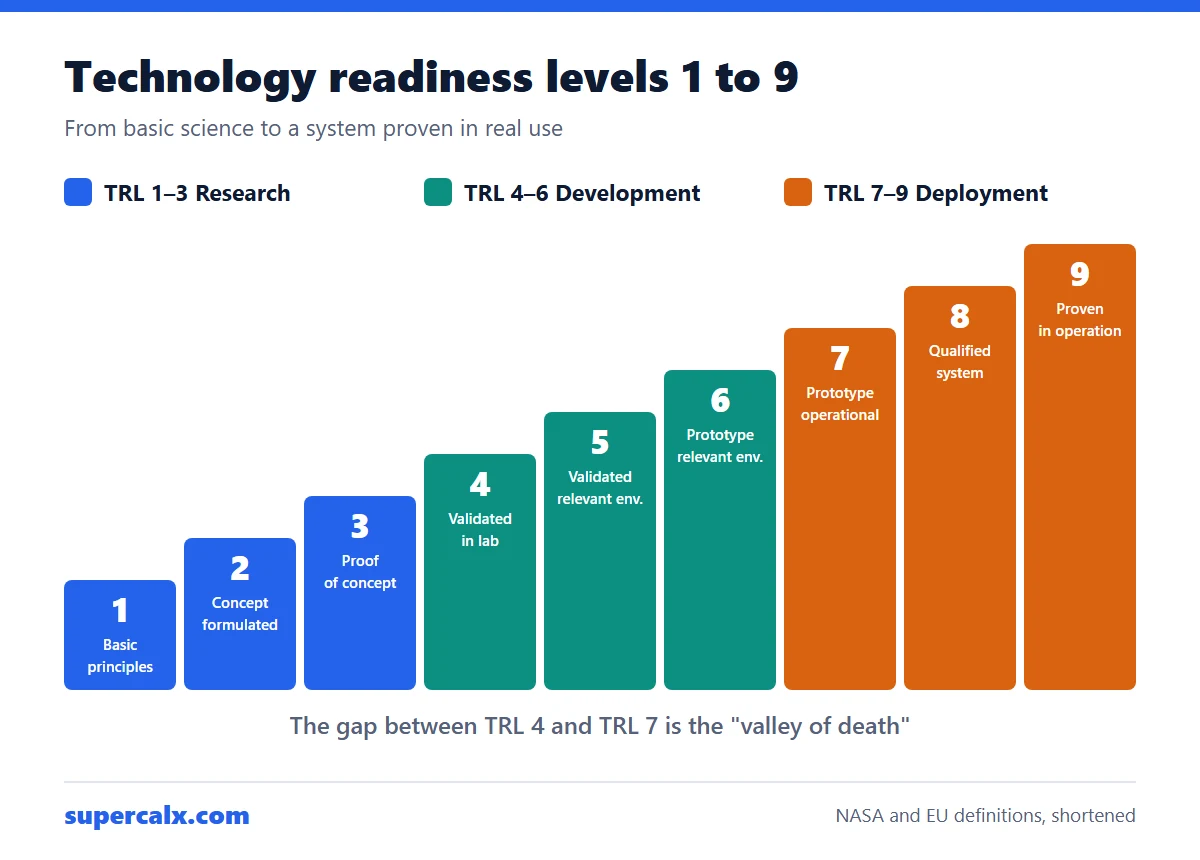
Technology readiness levels (TRLs) rate how mature a technology is on a scale of 1 to 9. TRL 1 means the basic science has been observed; TRL 3 is a lab proof of concept; TRL 6 is a prototype demonstrated in a realistic environment; TRL 9 is a system proven in real operation. The scale started at NASA and is now used by the EU, defence agencies and many funders.
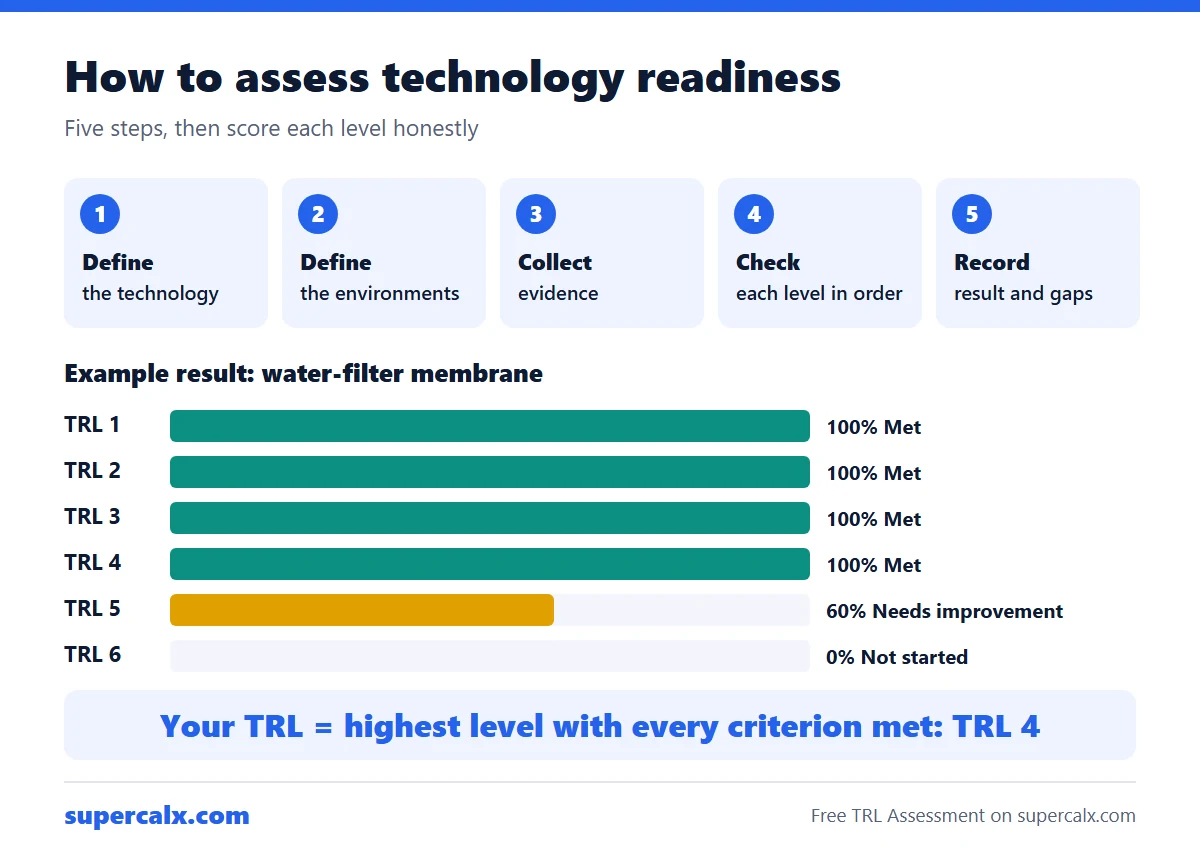
To assess technology readiness level, define exactly what the technology is and where it must eventually work, then check the evidence against each level in turn, starting at TRL 1. Your TRL is the highest level at which every criterion is fully met, not the level you are working towards. Record the evidence and the gaps, and have someone outside the team review it.
TRL 4 means the components work together in the lab. TRL 5 means those components have been validated under realistic conditions, called a relevant environment. TRL 6 means a representative prototype of the whole system, not just its components, has been demonstrated in that relevant environment. So 4 to 5 changes the environment, and 5 to 6 changes components into a system.
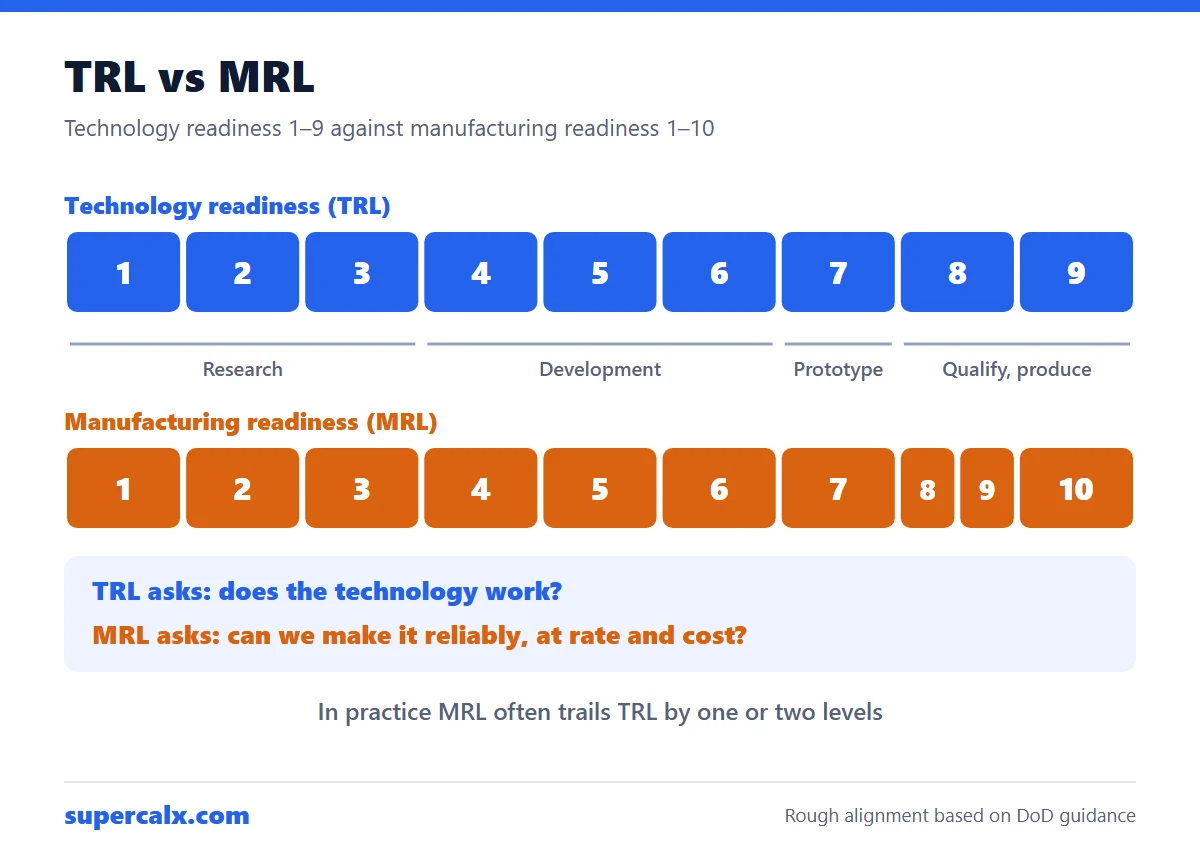
TRL measures whether a technology works; MRL measures whether it can be made reliably at the needed rate and cost. TRL runs from 1 to 9 and MRL from 1 to 10. The two rise roughly together, but a product can reach TRL 7 with a hand-built prototype while still at MRL 5 or 6. Hardware projects heading for production need both ratings.
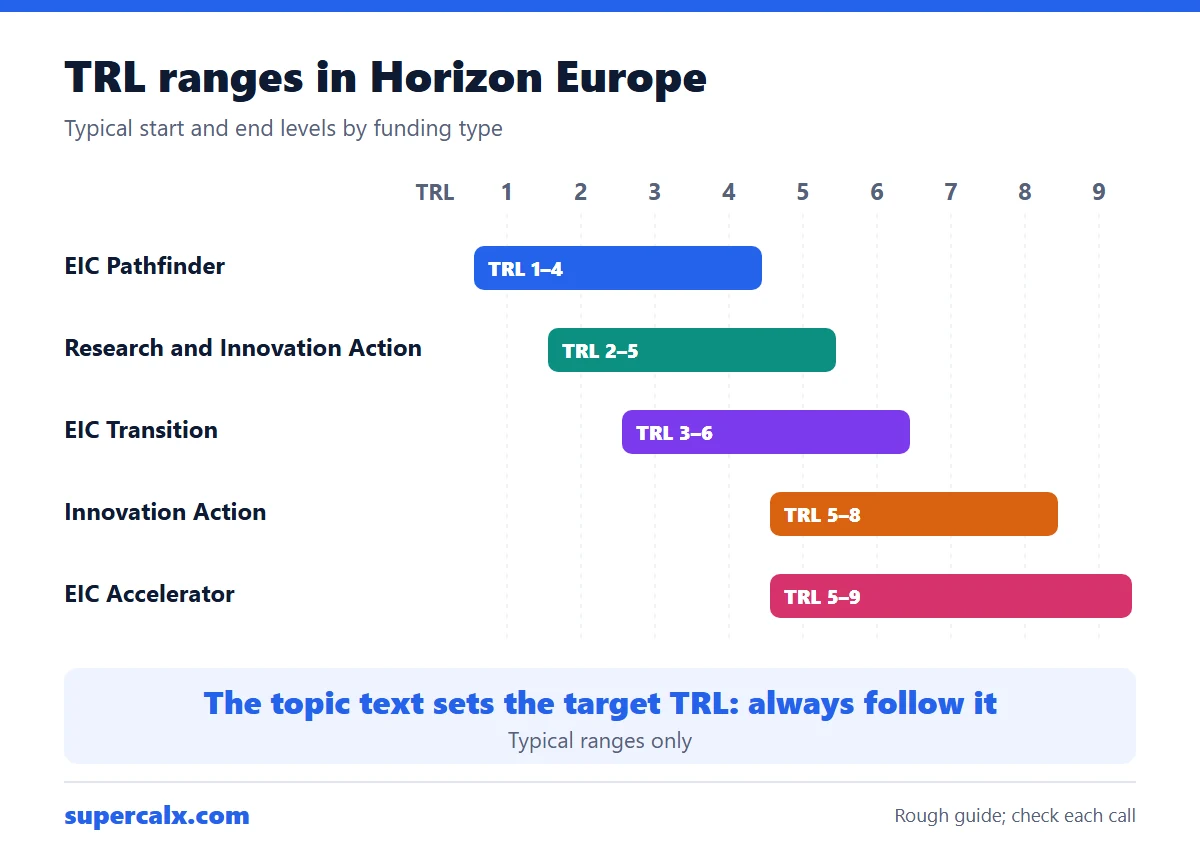
Horizon Europe uses the same nine TRL definitions as Horizon 2020. Each call topic states the TRL expected at the end of the project. As a rough guide, Research and Innovation Actions end around TRL 3 to 5, Innovation Actions around TRL 6 to 8, and EIC Transition moves from TRL 3 or 4 to TRL 5 or 6. State your starting TRL with evidence and show how the work plan reaches the target.
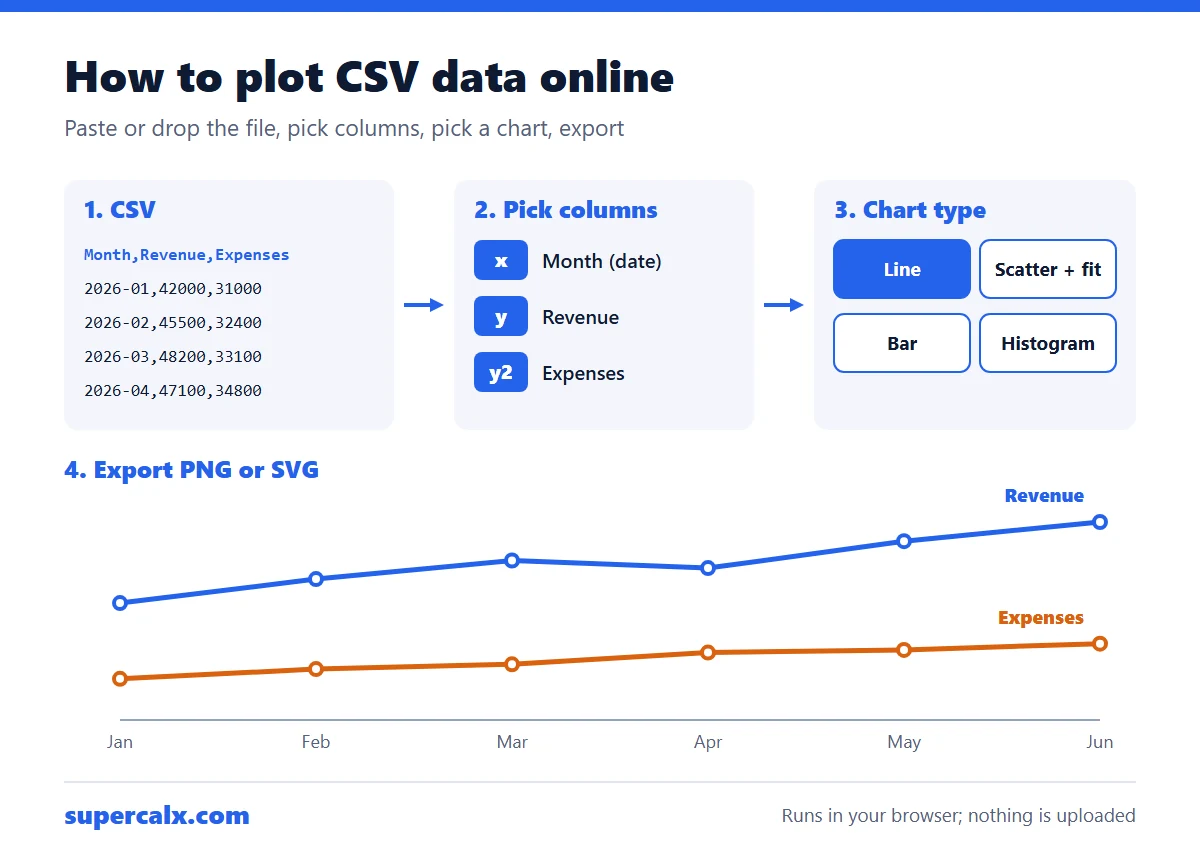
To plot CSV data online, put column names in the first row and one record per row, then paste the text or drop the file into a browser plotting tool. Choose the column for the x-axis and one or more for the y-axis, pick a chart type, and export the image. The free SuperCalX Data Plotter does this without code or sign-up, and nothing is uploaded.
A line of best fit is the line that makes the squared vertical distances from the points as small as possible. R squared (R²) is the share of the variation in y that the line explains, from 0 to 1. In the example below, y = 4.48x + 46.9 has R² = 0.99. Pick the fit type that matches the shape of the data, not the highest R² alone.
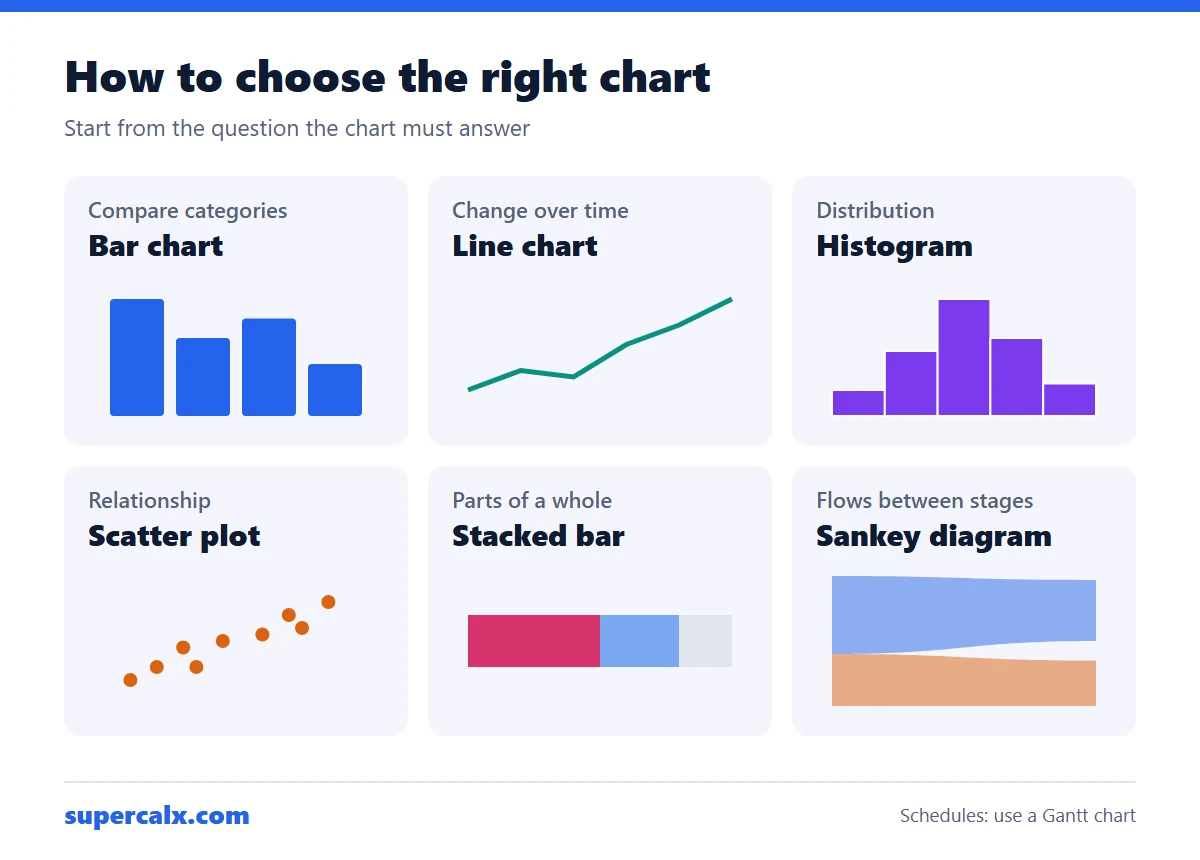
Choose a chart by the question it must answer. To compare categories, use a bar chart. To show change over time, use a line chart. To show a distribution, use a histogram or box plot. To show a relationship between two numbers, use a scatter plot. To show parts of a whole, use a stacked bar or, for a few parts, a pie. To show flows between stages, use a Sankey diagram.
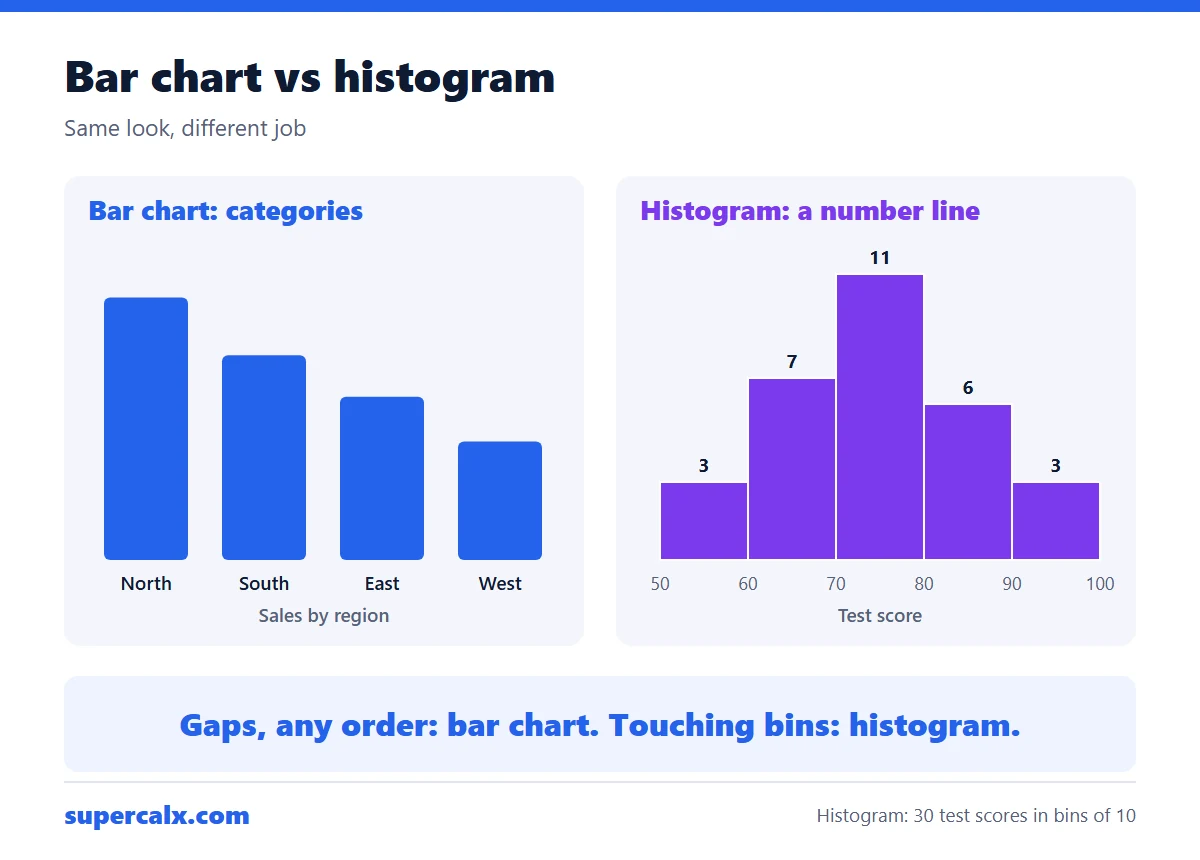
A bar chart compares separate categories, so its bars have gaps and can be in any order. A histogram shows the distribution of one numeric variable: the x-axis is a number line cut into ranges called bins, the bars touch, and their order is fixed. Use a bar chart for counts per category, such as sales by region, and a histogram for data such as heights or test scores.
To find outliers with the IQR rule, find the first quartile (Q1) and third quartile (Q3), subtract to get the interquartile range (IQR = Q3 − Q1), then set fences at Q1 − 1.5 × IQR and Q3 + 1.5 × IQR. Any value outside the fences is an outlier. For data with Q1 = 15 and Q3 = 19.5, the IQR is 4.5 and anything above 26.25 or below 8.25 is an outlier.
Electricity cost = watts ÷ 1,000 × hours used × price per kWh. A 1,500 W space heater running 5 hours a day uses 7.5 kWh a day. At $0.16 per kWh that costs $1.20 a day, or about $36 over a 30-day month.
To calculate age, subtract the birth year from the current year, then subtract 1 if this year's birthday has not happened yet. Someone born on March 15, 1990 is 36 on November 10, 2026: exactly 36 years, 7 months and 26 days, or 13,389 days.
To find a percentage of a number, multiply the number by the percentage and divide by 100: 15% of 80 is 80 × 15 ÷ 100 = 12. To find what percent one number is of another, divide and multiply by 100: 45 out of 60 is 45 ÷ 60 × 100 = 75%.
To count the days between two dates, subtract the earlier date from the later one. January 1 to March 1, 2027 is 59 days: 31 in January plus 28 in February. Add 1 if you need to count both the first and the last day.
Panels needed = monthly kWh ÷ 30 ÷ peak sun hours × 1.25 × 1,000 ÷ panel watts. A home using 900 kWh a month with 5 peak sun hours needs about 7.5 kW of solar, which is 19 panels of 400 W. The 1.25 allows for system losses.
Trip fuel cost = distance ÷ fuel economy × fuel price. Driving 300 miles in a car that gets 30 mpg uses 10 gallons; at $3.50 a gallon that costs $35. In metric, 500 km at 7 L/100 km uses 35 litres, which costs €63 at €1.80 a litre.