
PhD and Thesis Gantt Chart: Timeline Example by Month
By Dr. Ahmed Mortuza Saleque · Updated · How we check our content
The short answer
A thesis Gantt chart breaks the degree into overlapping stages: literature review, proposal and ethics, data collection, analysis, papers and writing, then submission. For a 36-month PhD, plan data collection around months 10 to 22 and writing from month 26, and add milestones such as the confirmation review at month 12. For a master thesis, use weeks or months over 4 to 9 months.
Open the Gantt Chart Maker →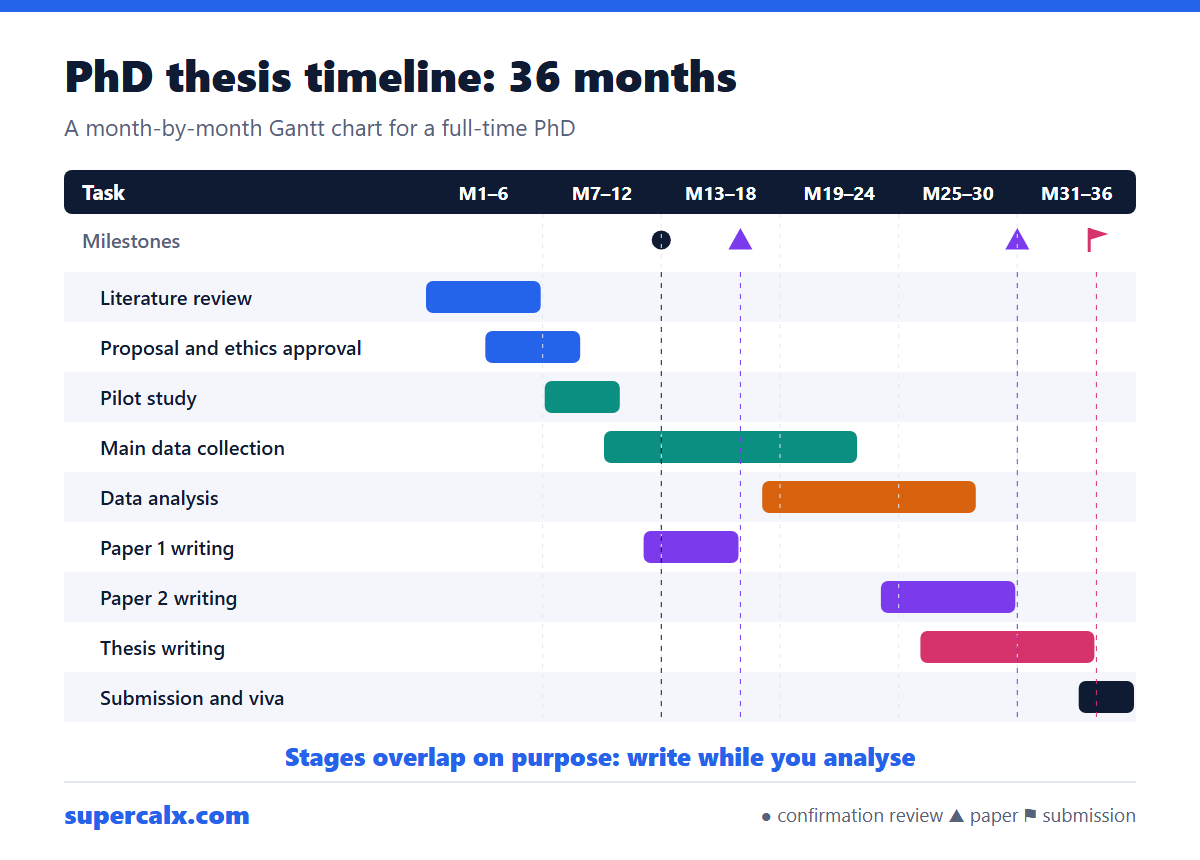
A 36-month PhD timeline
Full-time PhD. Stages overlap on purpose: you write while you analyse.
| Stage | Months | Length |
|---|---|---|
| Literature review | M1–M6 | 6 months |
| Research proposal and ethics approval | M4–M8 | 5 months |
| Pilot study | M7–M10 | 4 months |
| Main data collection | M10–M22 | 13 months |
| Data analysis | M18–M28 | 11 months |
| Paper 1 writing | M12–M16 | 5 months |
| Paper 2 writing | M24–M30 | 7 months |
| Thesis writing | M26–M34 | 9 months |
| Submission and viva preparation | M34–M36 | 3 months |
Milestones: confirmation review (M12), paper 1 submitted (M16), paper 2 submitted (M30) and thesis submission (M34). This exact plan is the PhD thesis example in the Gantt Chart Maker, so you can load it and change the months.
A 6-month master thesis
| Stage | Months |
|---|---|
| Topic, supervisor meetings and proposal | M1 |
| Literature review | M1–M2 |
| Method and data collection | M2–M4 |
| Analysis | M3–M5 |
| Writing chapters | M3–M6 |
| Final edit, formatting and submission | M6 |
For a thesis of six months or less, switch the chart to month columns and set the snap to about a week so you can place short tasks precisely.
Rules that keep a thesis plan realistic
- Overlap writing with analysis. Theses that start writing only after all analysis is done usually overrun.
- Put ethics approval before any data collection bar, and allow 2 to 3 months for it.
- Add buffer: about 10% of the total time, placed before submission, not spread thinly.
- Mark holidays, teaching duties and conferences. The days off calculator helps count time you will not be working on the thesis.
- Update the chart every few months and show it at supervisor meetings. Progress percentages on each bar make slippage obvious.
Make yours from the template
- Open the Gantt Chart Maker, choose Paste your plan and load the PhD thesis example.
- Edit the lines. Times can be written as M4-M9, as calendar months such as Jan-Jun 2027, or as a length such as 6 months, which starts after the previous task.
- Add Milestone:, Deliverable: or Deadline: lines for reviews, papers and submission.
- Choose a style (Minimal or Print work well for a thesis appendix) and export a PNG, SVG or PDF.
To turn calendar dates into month numbers, count the months from your start date with the date calculator.
Common questions
How long should each stage of a PhD take?
For a 3-year full-time PhD, a common split is about 6 months of reading and proposal, 12 to 15 months of data collection, a year of analysis overlapping with it, and 8 to 9 months of writing.
Should a thesis Gantt chart use weeks or months?
Months for a PhD, weeks or months for a master or bachelor thesis of under 9 months.
Where does a Gantt chart go in a thesis proposal?
Usually in the timeline or work plan section near the end, or as an appendix if the page limit is tight.
Can I share my thesis timeline with my supervisor?
Yes. Export a PNG or PDF, or use Copy link in the Gantt Chart Maker, which stores the plan in the link itself.
Calculators for this article
More from the blog
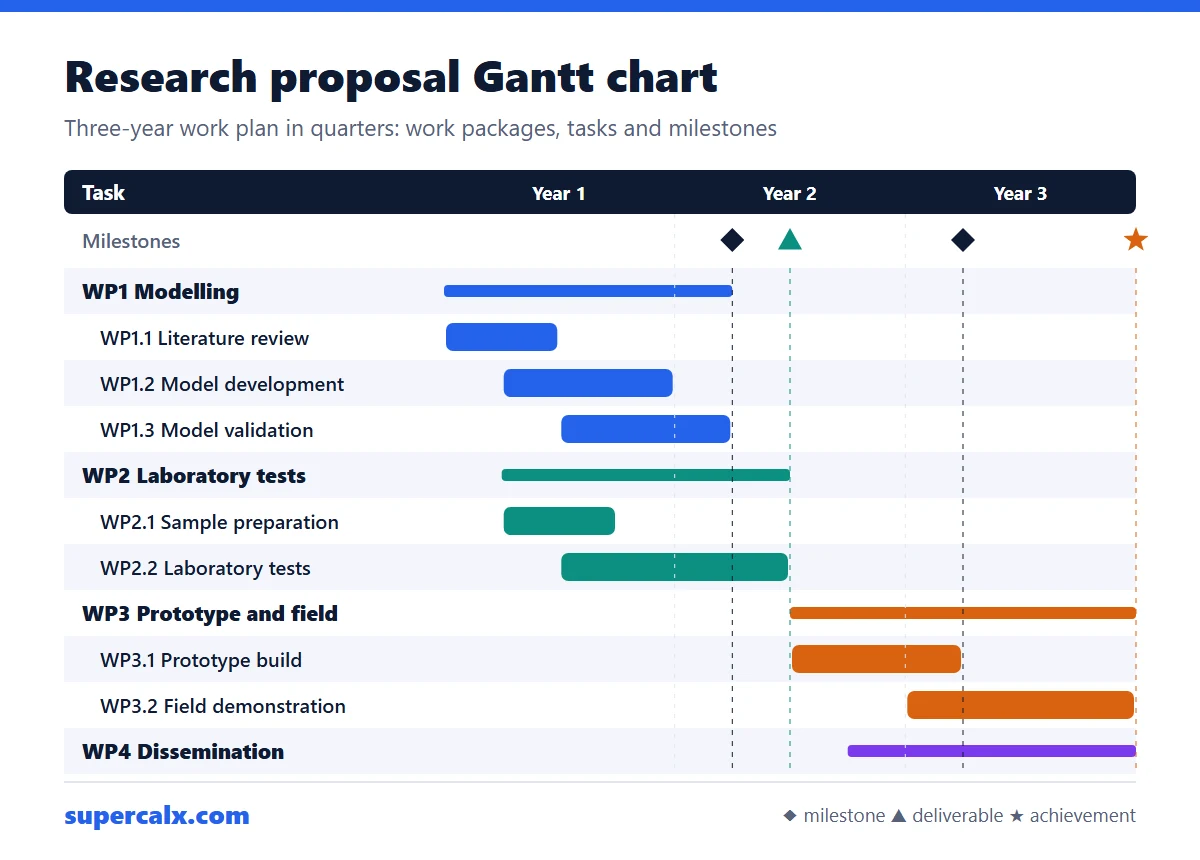 Gantt Chart for a Research Proposal: Example and Template
 Gantt Chart Milestones and Deliverables: How to Show Them
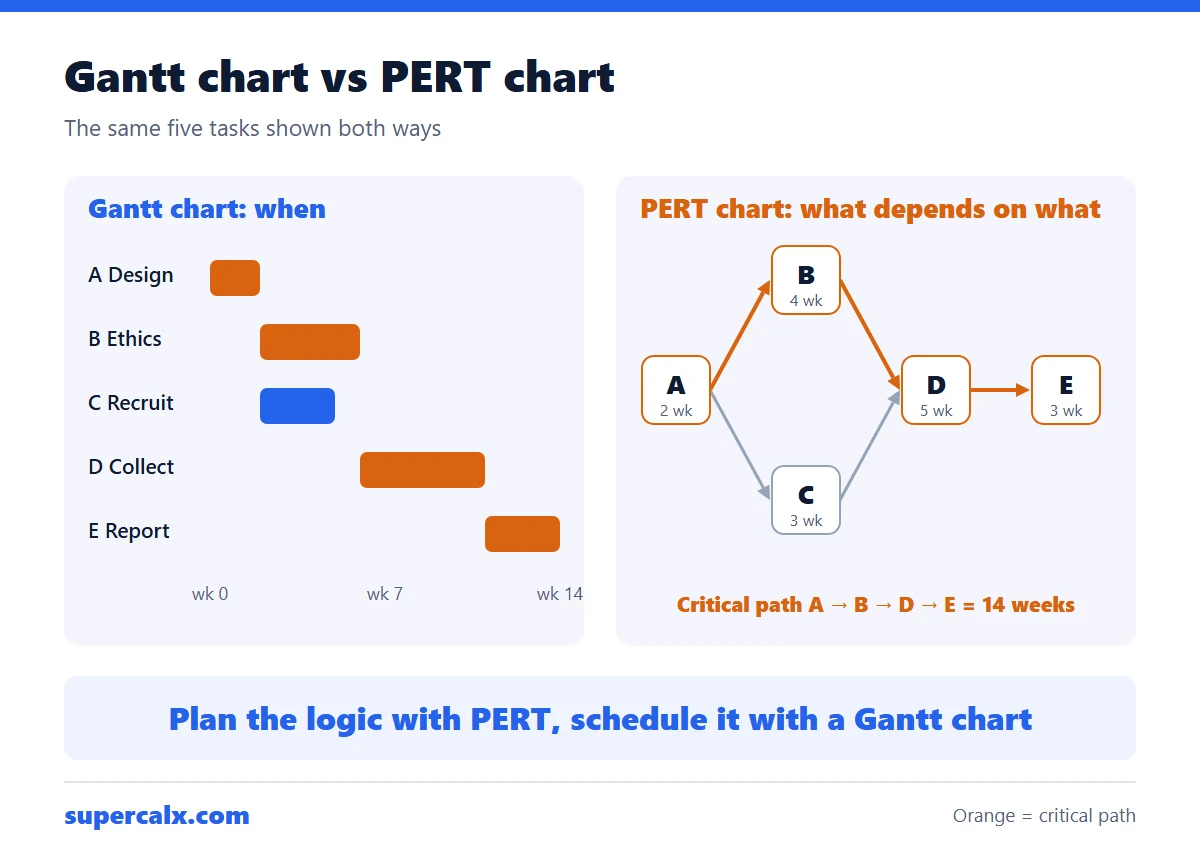 Gantt Chart vs PERT Chart vs Timeline: Which to Use
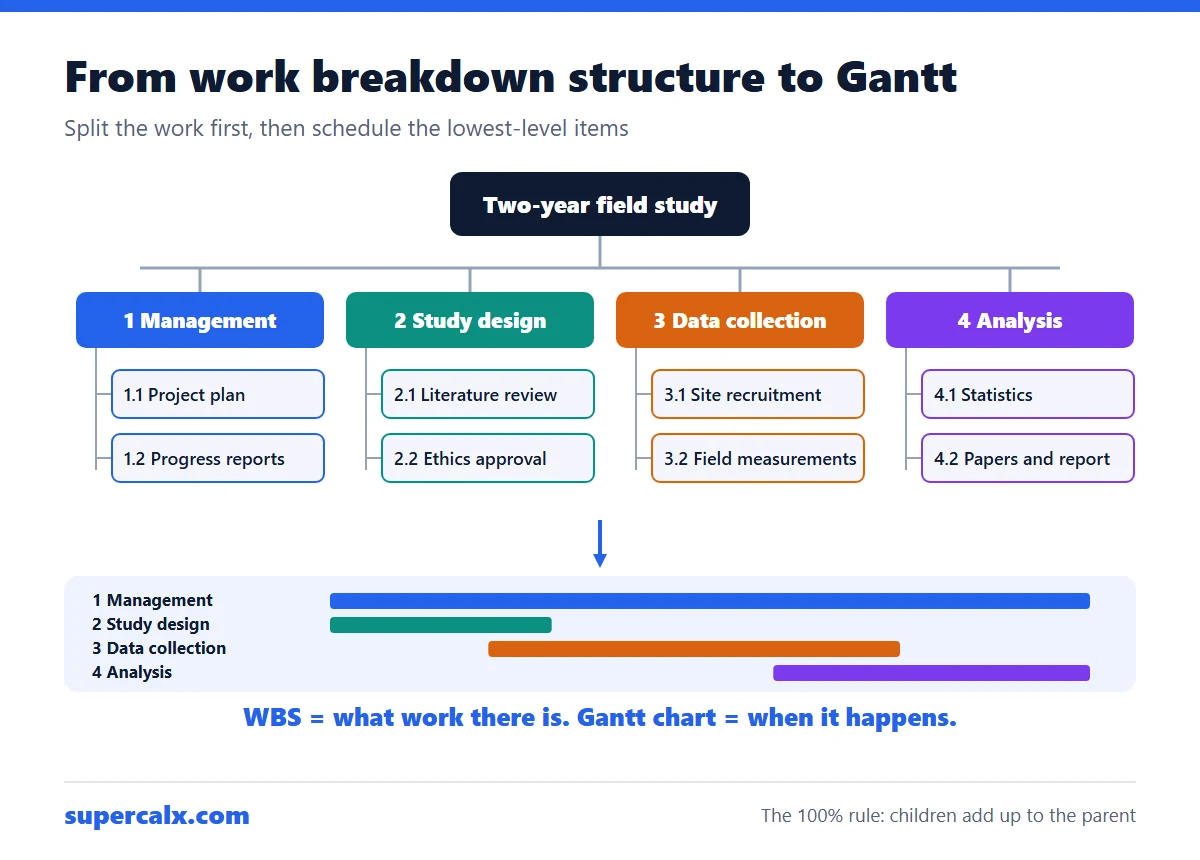 Work Breakdown Structure Example: From WBS to Gantt Chart
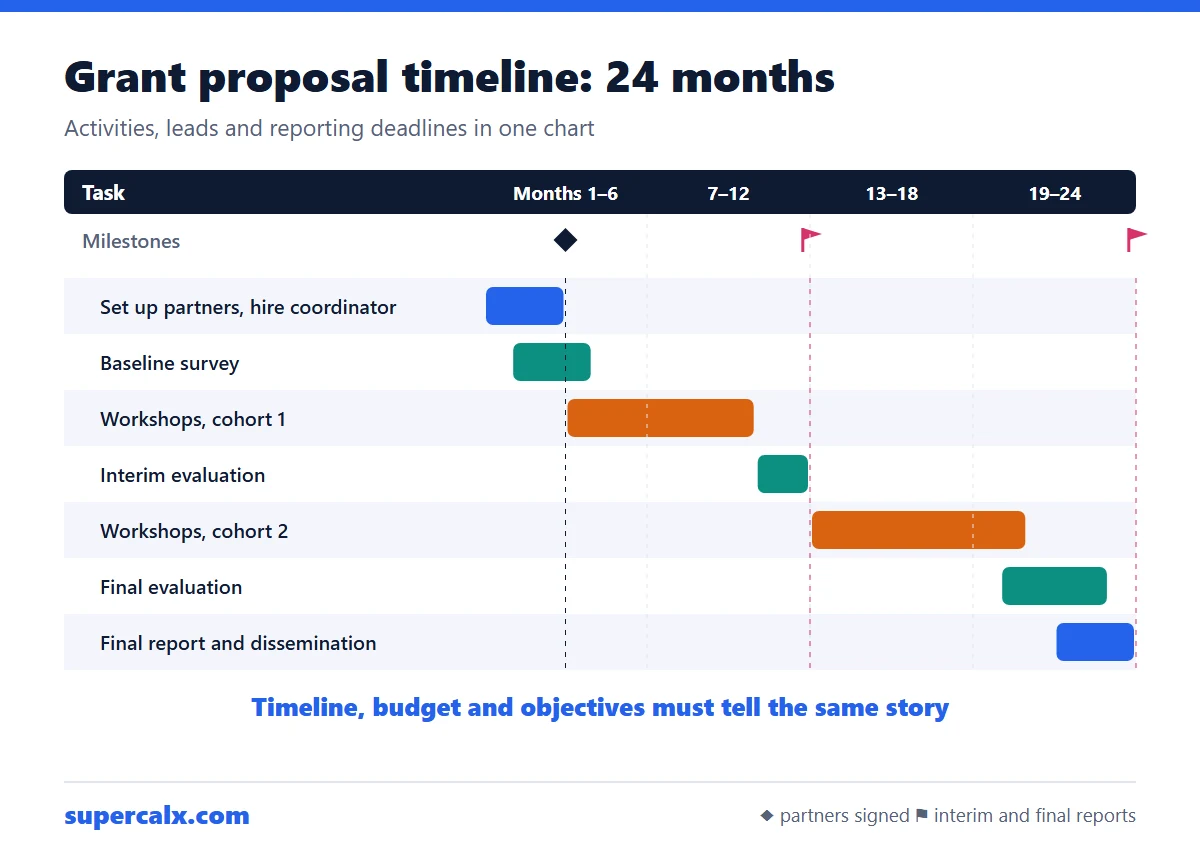 How to Write a Grant Proposal Timeline (With Example)
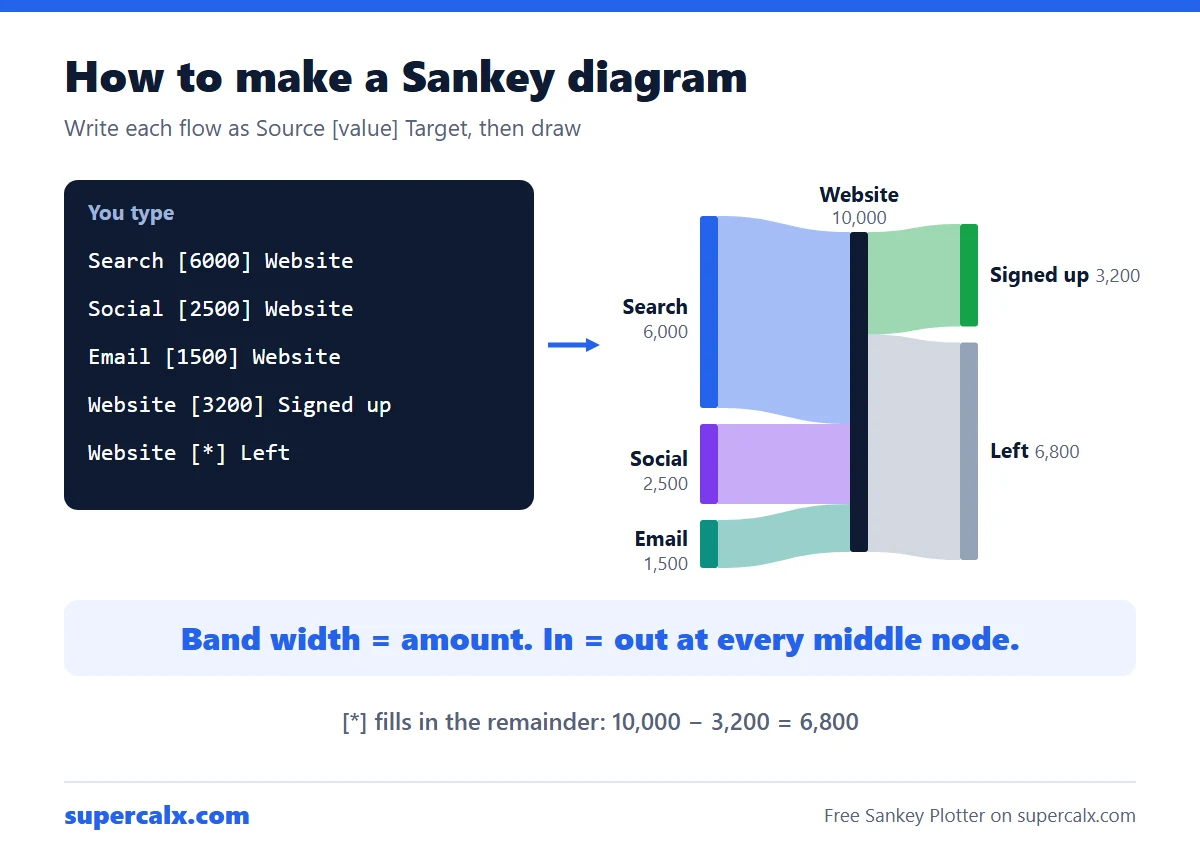 How to Make a Sankey Diagram (Free, No Excel Add-in)
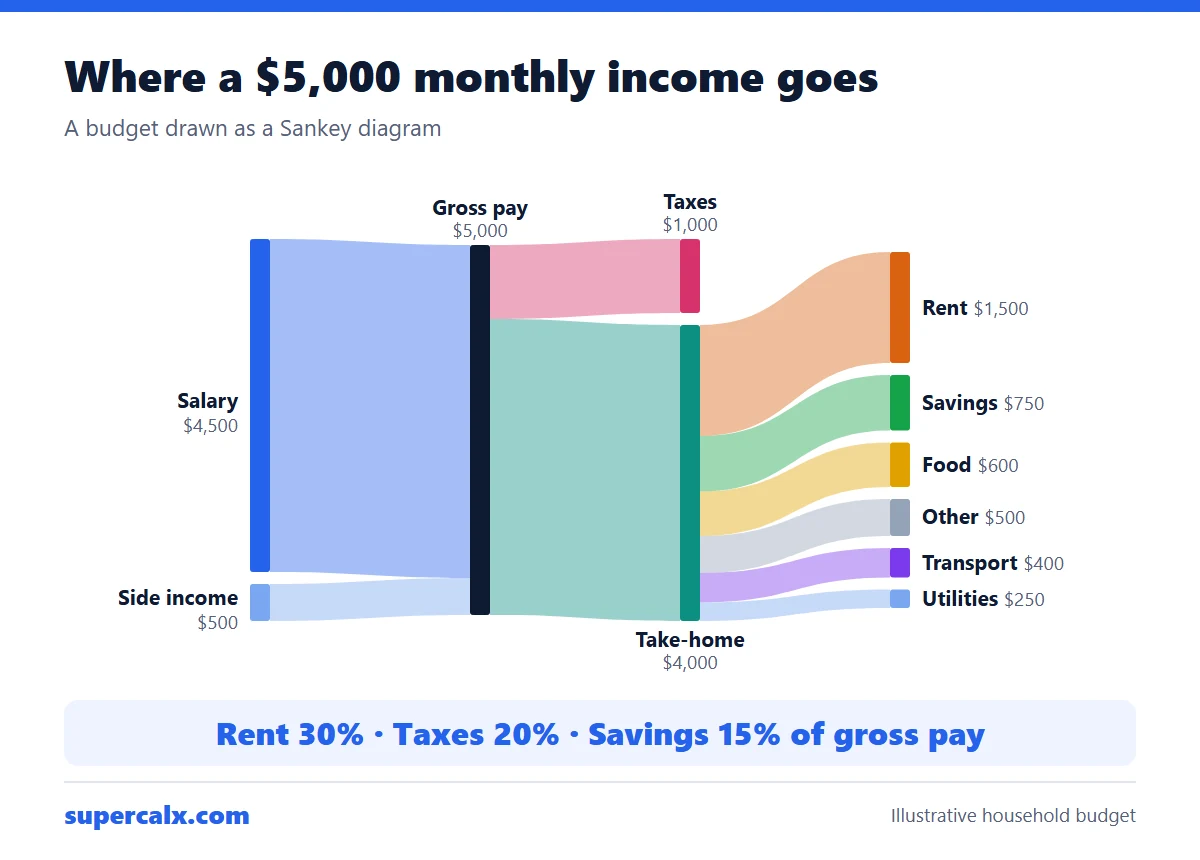 Sankey Diagram for a Budget: See Where Your Money Goes
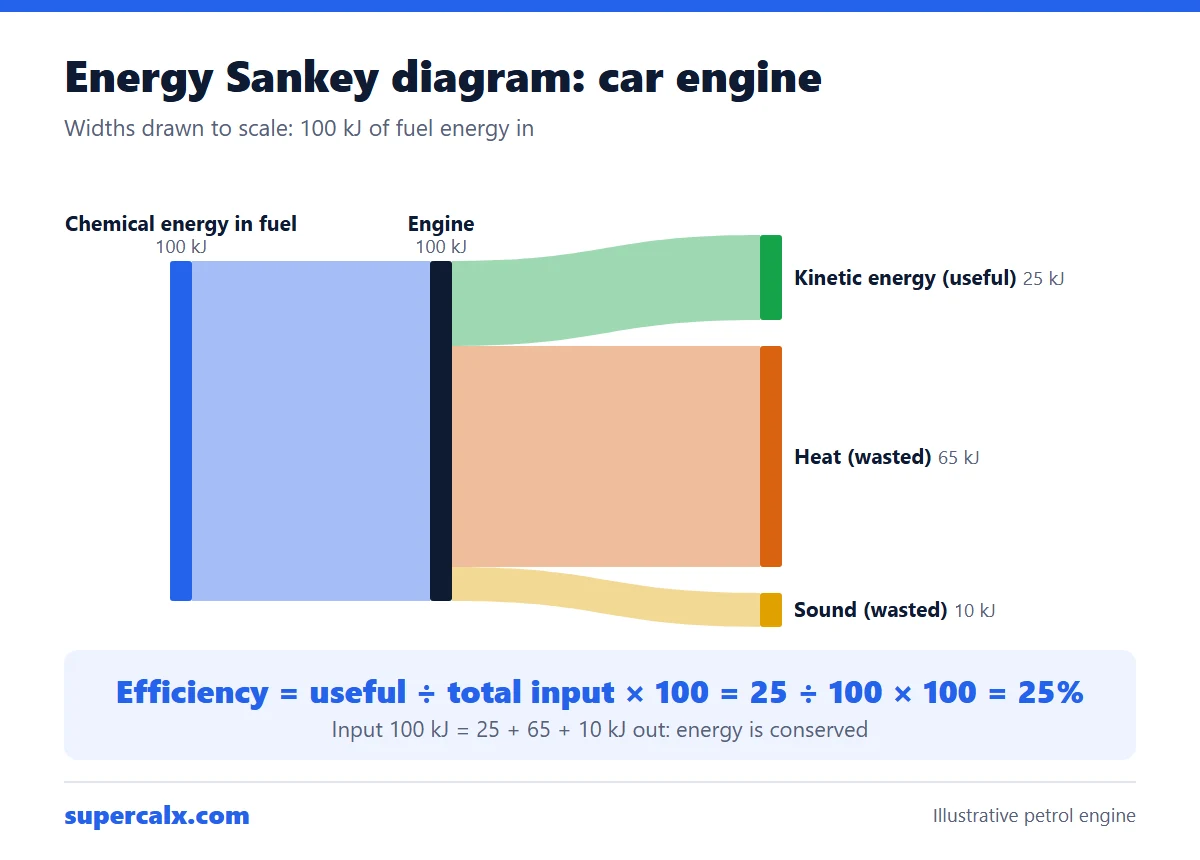 Energy Sankey Diagram: How to Draw One and Find Efficiency