Bar Chart vs Histogram: The Difference and When to Use Each
By Dr. Ahmed Mortuza Saleque · Updated · How we check our content
The short answer
A bar chart compares separate categories, so its bars have gaps and can be in any order. A histogram shows the distribution of one numeric variable: the x-axis is a number line cut into ranges called bins, the bars touch, and their order is fixed. Use a bar chart for counts per category, such as sales by region, and a histogram for data such as heights or test scores.
Open the Data Plotter →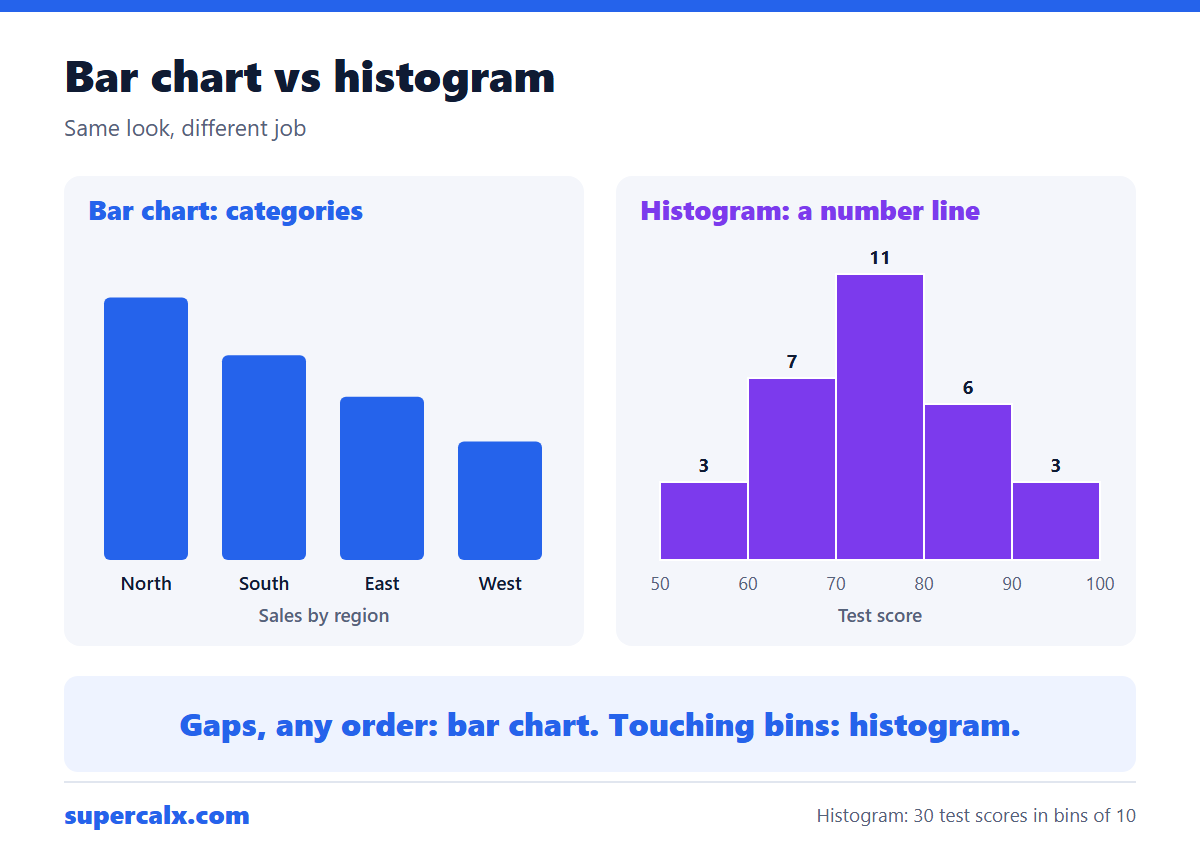
Key differences
| Bar chart | Histogram | |
|---|---|---|
| Data type | Categories | One numeric variable |
| x-axis | Category names | Number line split into bins |
| Gaps between bars | Yes | No, bars touch |
| Can reorder bars | Yes, e.g. by size | No, order is numeric |
| Bar height means | A value or count per category | How many values fall in each bin |
| Shows | Comparison | Shape, centre and spread |
Worked example: 30 test scores
Thirty students' scores grouped into bins 10 points wide.
| Score range | Students |
|---|---|
| 50–59 | 3 |
| 60–69 | 7 |
| 70–79 | 11 |
| 80–89 | 6 |
| 90–99 | 3 |
Drawn as a histogram, the five bars touch and rise to a peak at 70–79, then fall away almost evenly: the scores are roughly symmetric around the mid-70s. Swapping the bars would make no sense, because the x-axis is a number line.
A bar chart of the same class would answer a different question, such as the average score of each of three teaching groups. Those groups have no numeric order, so the bars have gaps and can be sorted from highest to lowest.
Choosing the bin width
- Start with about √n bins: √30 ≈ 5.5, so 5 or 6 bins for 30 values.
- Sturges' rule gives 1 + log₂(n) bins, about 6 for 30 values; it works for roughly bell-shaped data.
- Use round edges (50, 60, 70) so readers can interpret the bins.
- Try two or three widths. Too few bins hide the shape; too many make it noisy.
Make either chart from your data
Paste your data into the Data Plotter: choose Bar for a category column with values, or Histogram for a single numeric column. It also lists the mean, median, quartiles and skewness, so you can describe the shape in numbers. For a quick summary by hand, use the 5-number summary calculator or the descriptive statistics calculator.
Common questions
Why do histogram bars touch?
Because the bins are adjacent ranges on a continuous number line; there is no gap between 59.9 and 60.
Is a column chart the same as a histogram?
No. A column chart is a vertical bar chart of categories. It only looks like a histogram.
Can a histogram have categories on the x-axis?
No. If the x-axis shows categories, it is a bar chart.
When should I use a box plot instead of a histogram?
When comparing several groups at once, or when you want the median, quartiles and outliers to stand out.
Calculators for this article
More from the blog
 Gantt Chart for a Research Proposal: Example and Template
 PhD and Thesis Gantt Chart: Timeline Example by Month
 Gantt Chart Milestones and Deliverables: How to Show Them
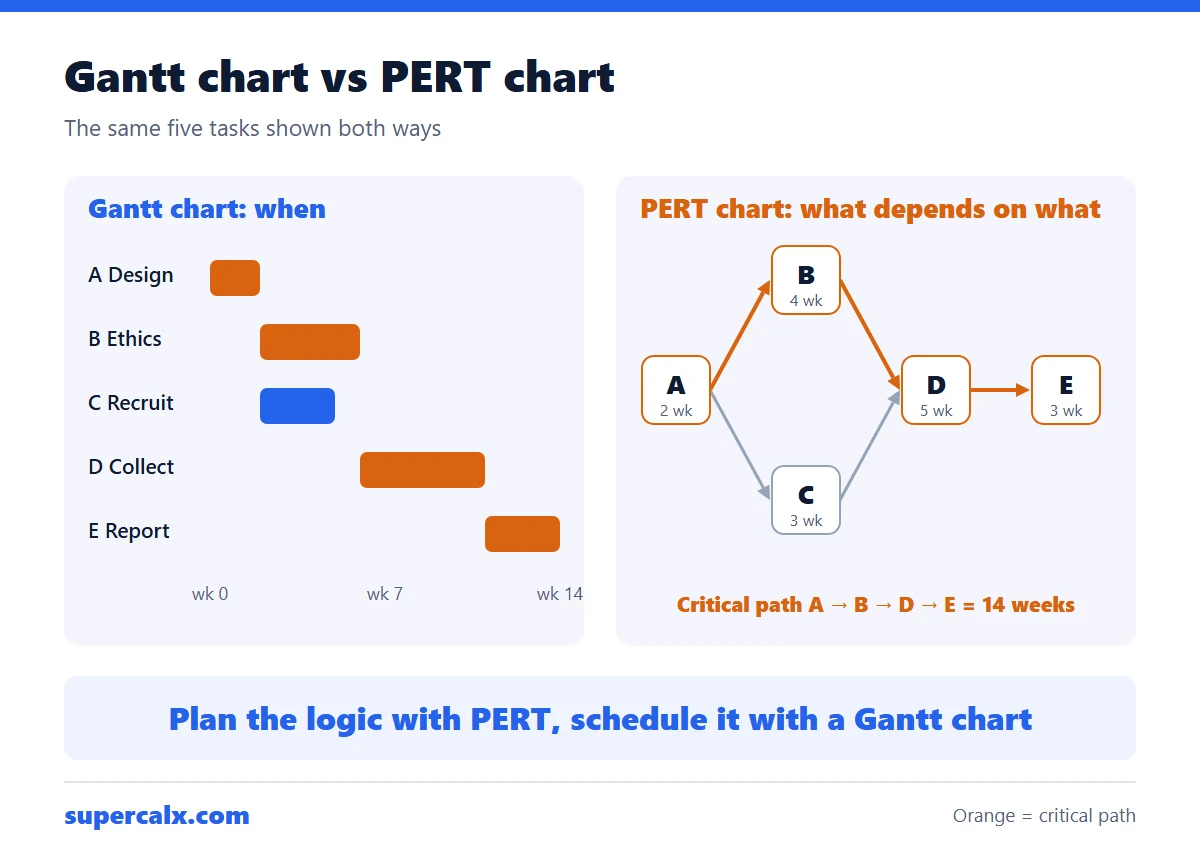 Gantt Chart vs PERT Chart vs Timeline: Which to Use
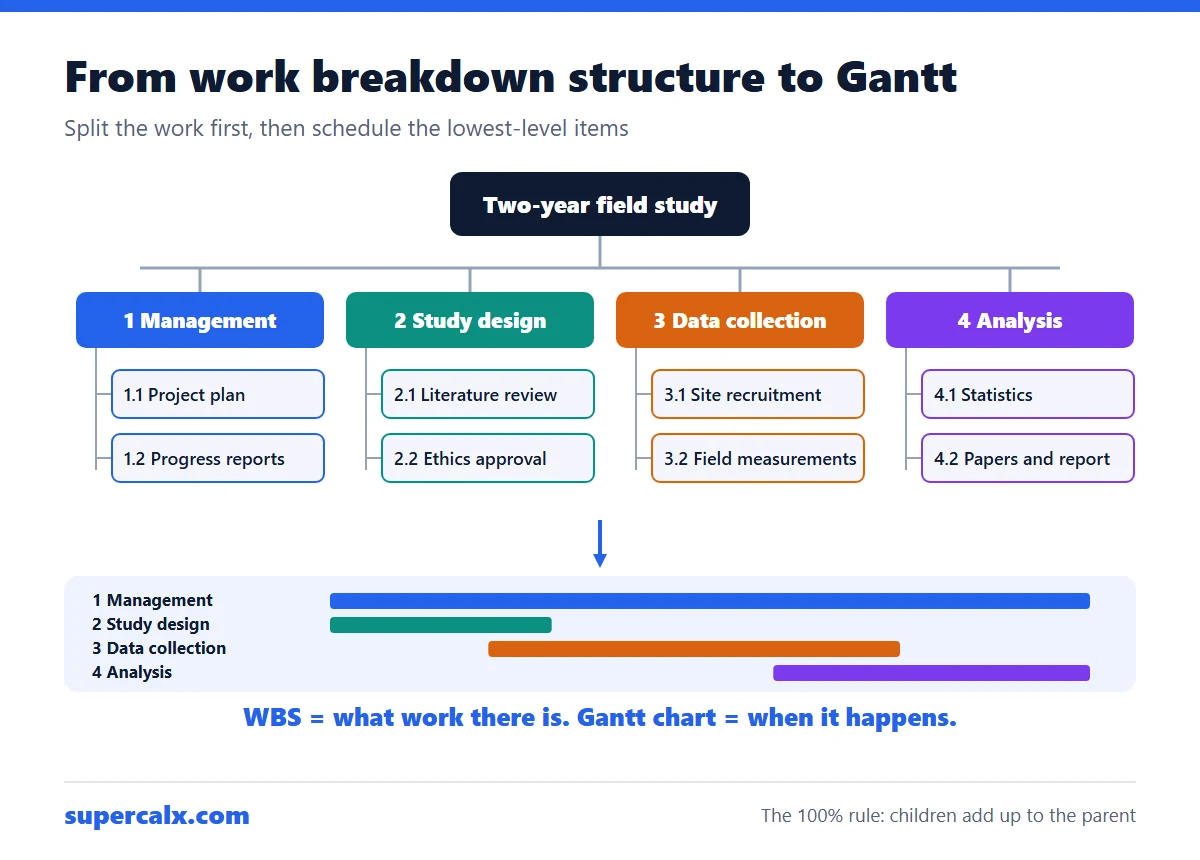 Work Breakdown Structure Example: From WBS to Gantt Chart
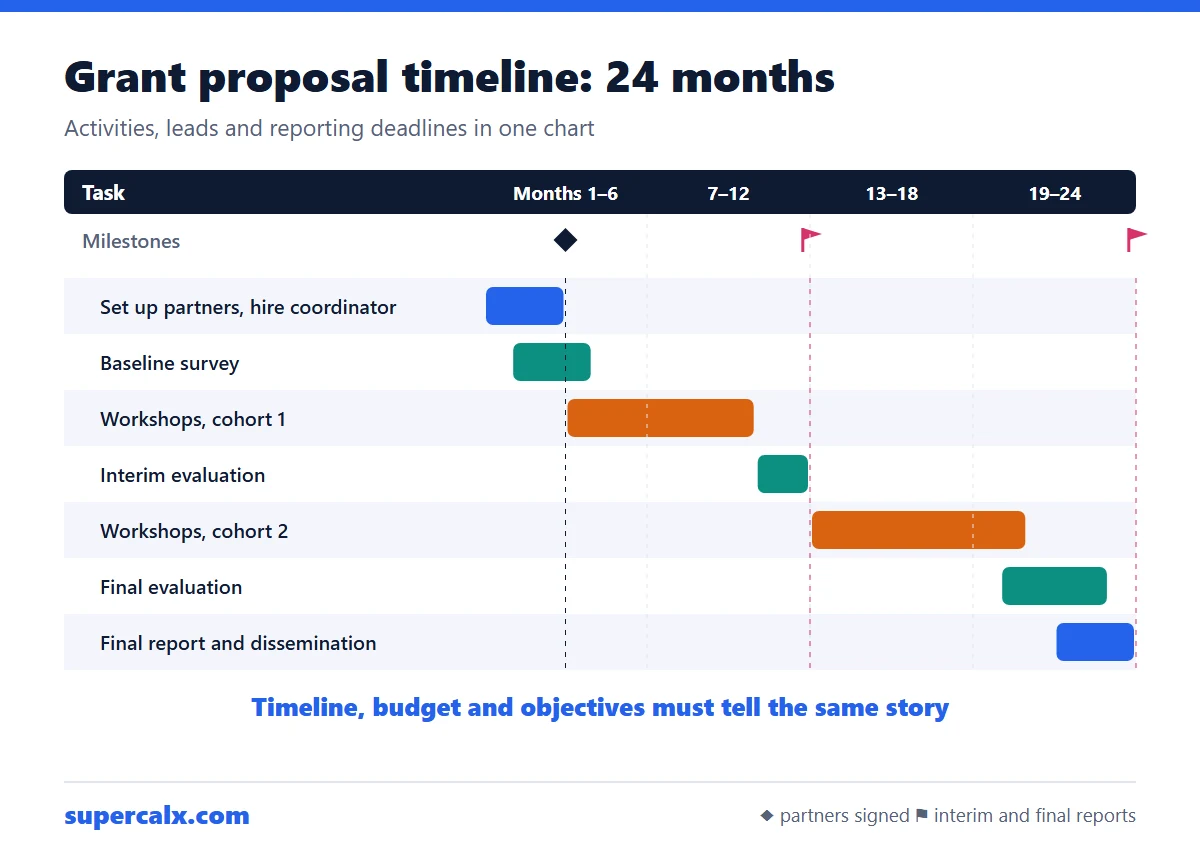 How to Write a Grant Proposal Timeline (With Example)
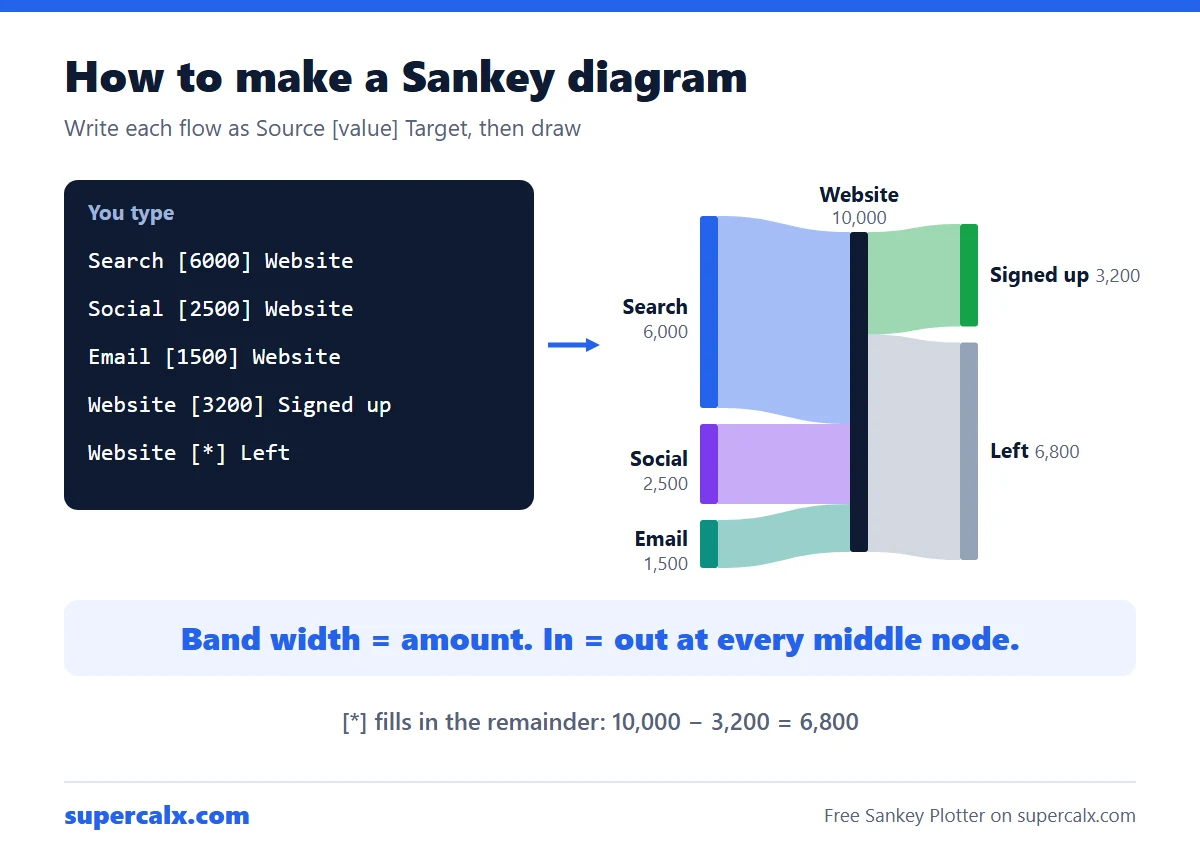 How to Make a Sankey Diagram (Free, No Excel Add-in)
 Sankey Diagram for a Budget: See Where Your Money Goes