
How to Find Outliers With the 1.5 IQR Rule
By Dr. Ahmed Mortuza Saleque · Updated · How we check our content
The short answer
To find outliers with the IQR rule, find the first quartile (Q1) and third quartile (Q3), subtract to get the interquartile range (IQR = Q3 − Q1), then set fences at Q1 − 1.5 × IQR and Q3 + 1.5 × IQR. Any value outside the fences is an outlier. For data with Q1 = 15 and Q3 = 19.5, the IQR is 4.5 and anything above 26.25 or below 8.25 is an outlier.
Open the Data Plotter →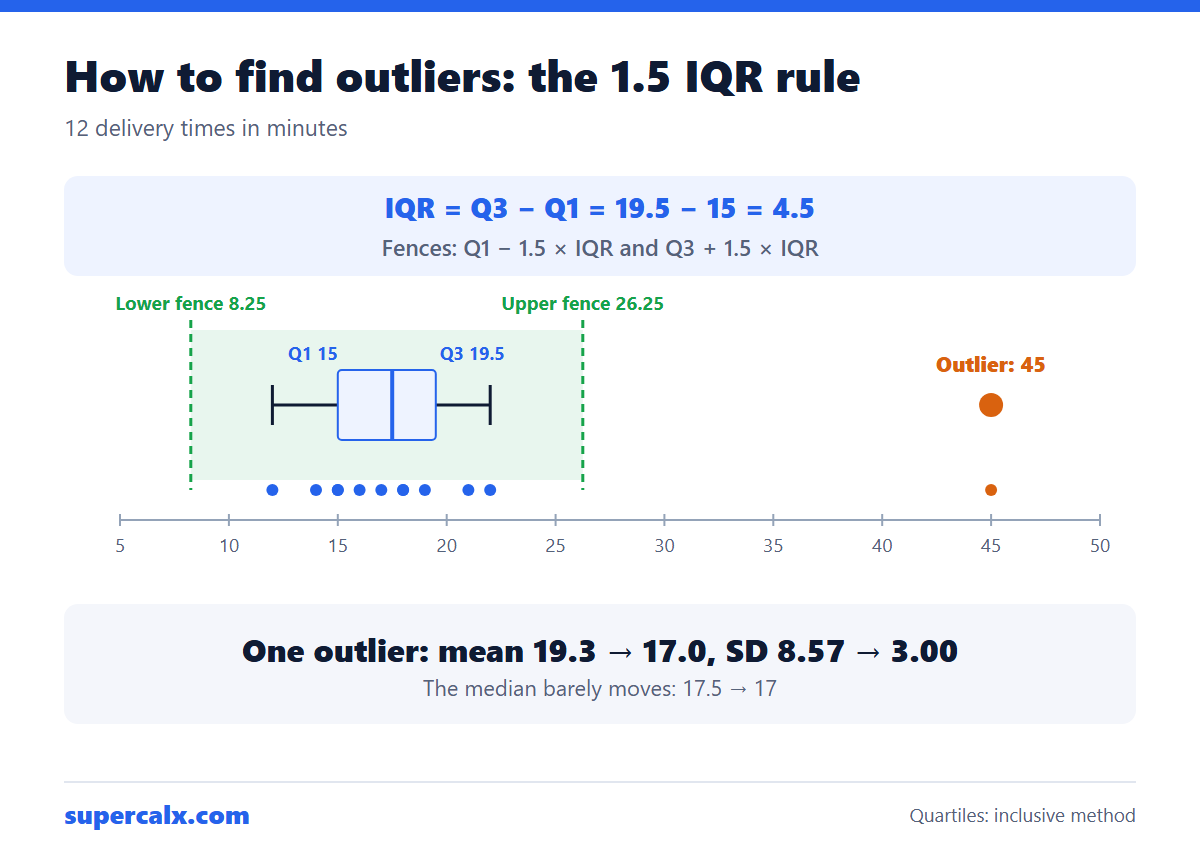
Worked example
- Sort the data. Twelve delivery times in minutes: 12, 14, 15, 15, 16, 17, 18, 18, 19, 21, 22, 45.
- Q1 = 15 and Q3 = 19.5 (the median is 17.5).
- IQR = 19.5 − 15 = 4.5.
- Lower fence = 15 − 1.5 × 4.5 = 8.25.
- Upper fence = 19.5 + 1.5 × 4.5 = 26.25.
- 45 is above 26.25, so it is an outlier. Nothing is below 8.25.
Why one outlier matters
| Statistic | With 45 | Without 45 |
|---|---|---|
| Mean | 19.3 | 17.0 |
| Median | 17.5 | 17 |
| Standard deviation | 8.57 | 3.00 |
One value nearly triples the standard deviation and pulls the mean up by more than 2 minutes, while the median hardly moves. That is why the median and IQR are preferred for skewed data. Check these with the IQR calculator and the 5-number summary calculator.
Quartile methods give slightly different answers
There are several ways to compute quartiles. Excel's QUARTILE.INC gives Q3 = 19.5 here, while QUARTILE.EXC and some textbooks give 20.5. The fences shift a little, but a clear outlier such as 45 is flagged either way. Use one method consistently and say which one you used.
Find outliers automatically
Paste a column into the Data Plotter. Its insights panel counts outliers with the 1.5 × IQR rule, the box plot draws them as separate points, and the Remove outliers switch redraws every chart without them so you can compare. It also warns when a column is strongly skewed, which often explains apparent outliers.
Should you remove an outlier?
- Remove it if it is an error: a typo, a faulty sensor reading, a unit mix-up.
- Keep it if it is real. A 45-minute delivery is real information about what customers experience.
- If unsure, report results with and without it.
- Never remove points just to improve R² or reach significance.
- For bell-shaped data, a z-score above 3 is another common test; see the z-score calculator.
Common questions
What is the 1.5 IQR rule?
A value is an outlier if it is more than 1.5 interquartile ranges below the first quartile or above the third quartile.
What is an extreme outlier?
A value more than 3 × IQR beyond the quartiles. In the example, the extreme upper fence is 19.5 + 13.5 = 33, and 45 is an extreme outlier too.
Why 1.5 times the IQR?
John Tukey chose it for box plots. For normally distributed data, it flags about 0.7% of values, so real outliers stand out.
How are outliers shown on a box plot?
As separate dots beyond the whiskers, which end at the most extreme values still inside the fences.
Calculators for this article
More from the blog
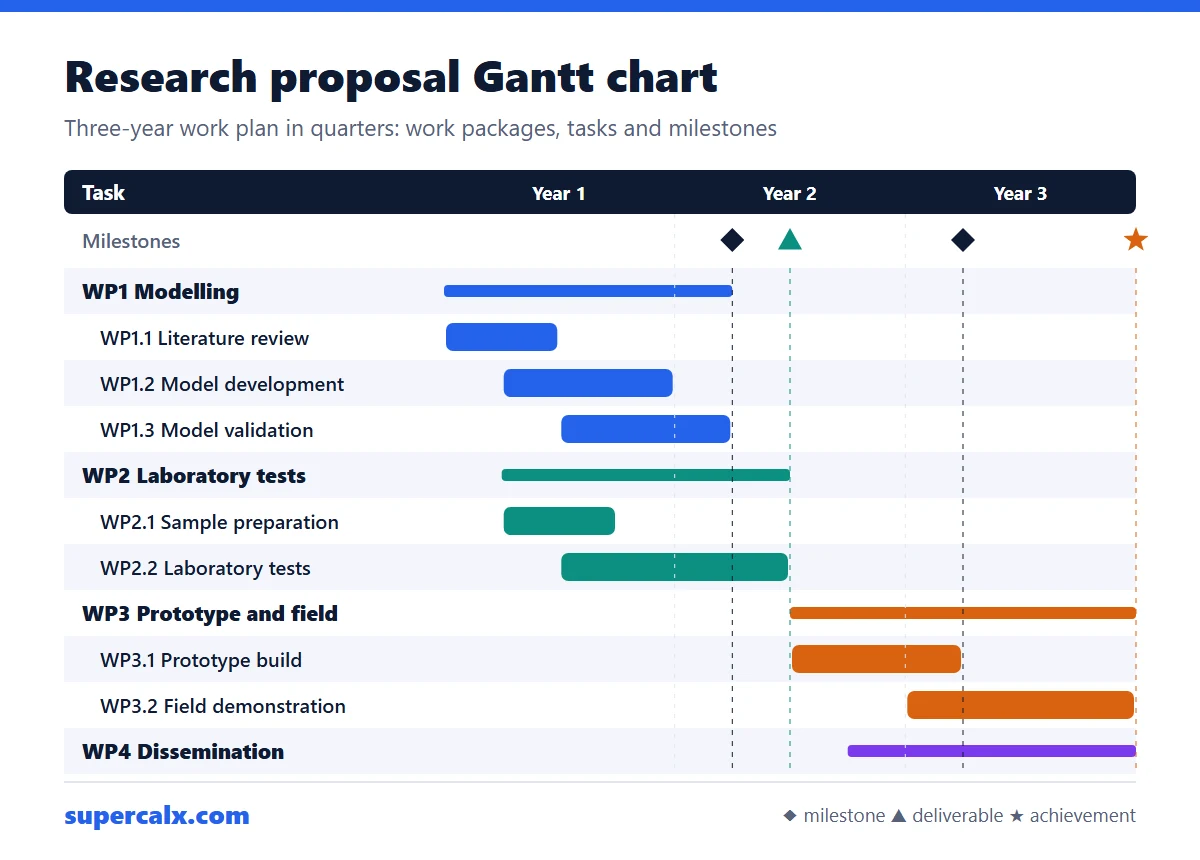 Gantt Chart for a Research Proposal: Example and Template
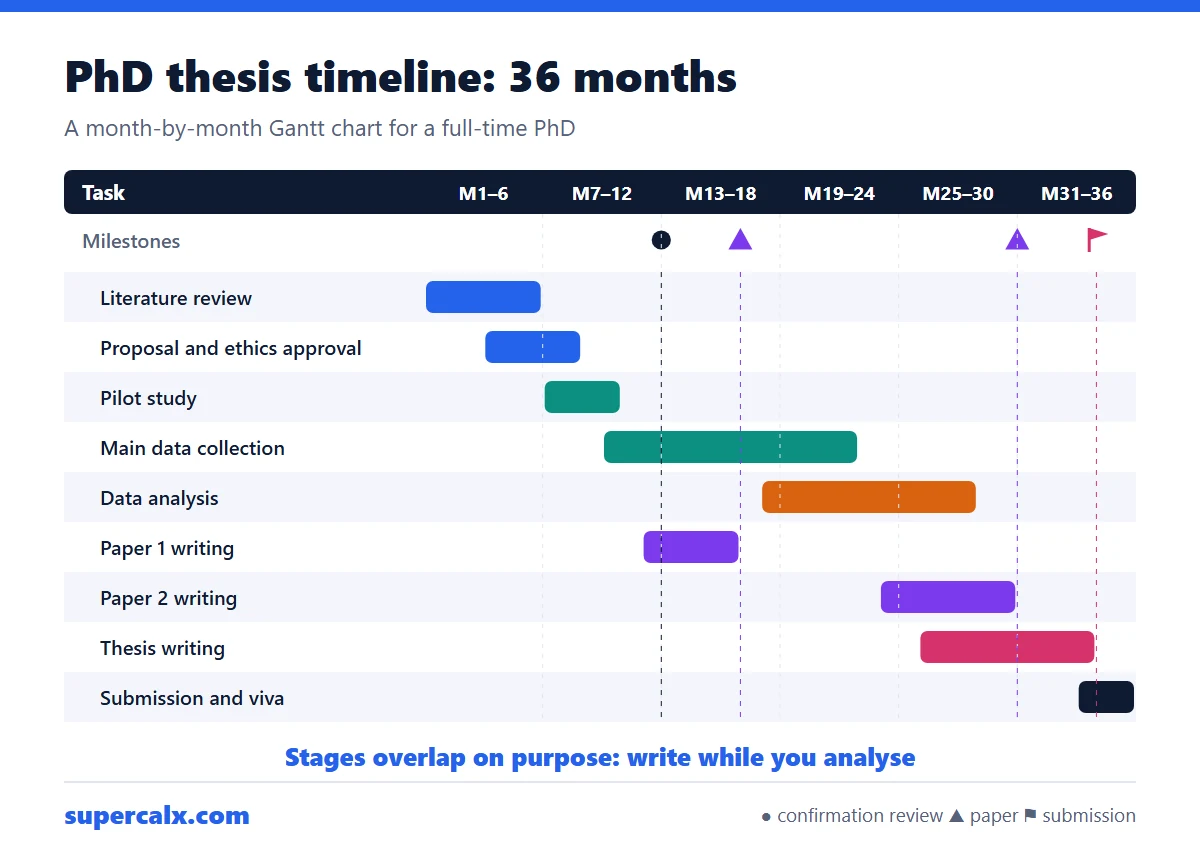 PhD and Thesis Gantt Chart: Timeline Example by Month
 Gantt Chart Milestones and Deliverables: How to Show Them
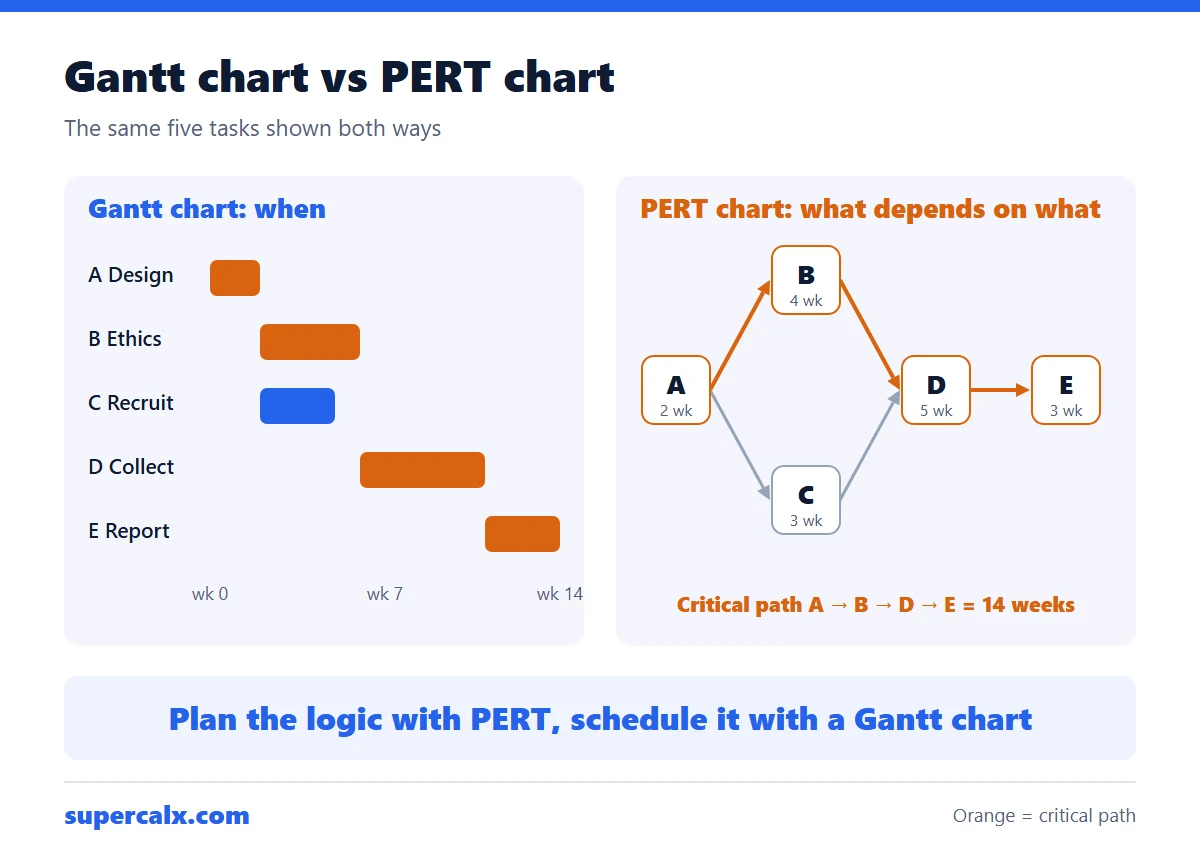 Gantt Chart vs PERT Chart vs Timeline: Which to Use
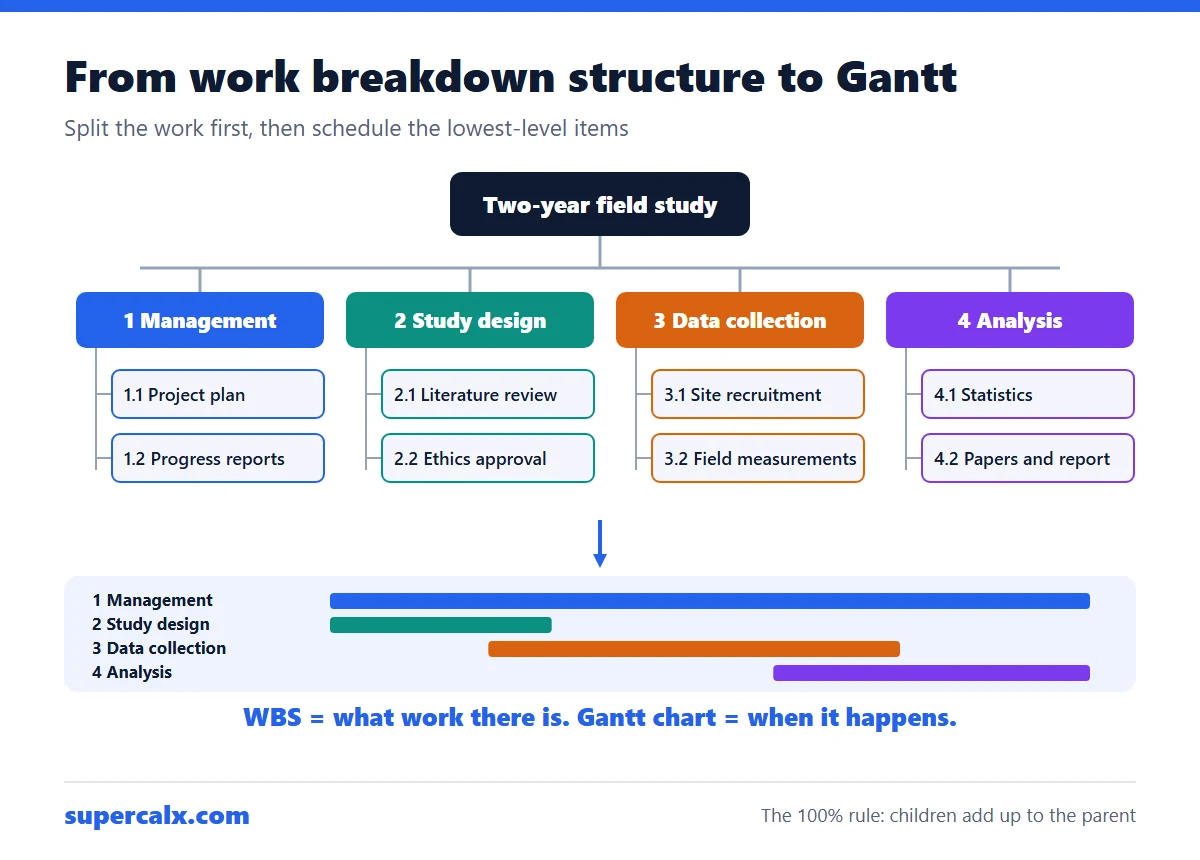 Work Breakdown Structure Example: From WBS to Gantt Chart
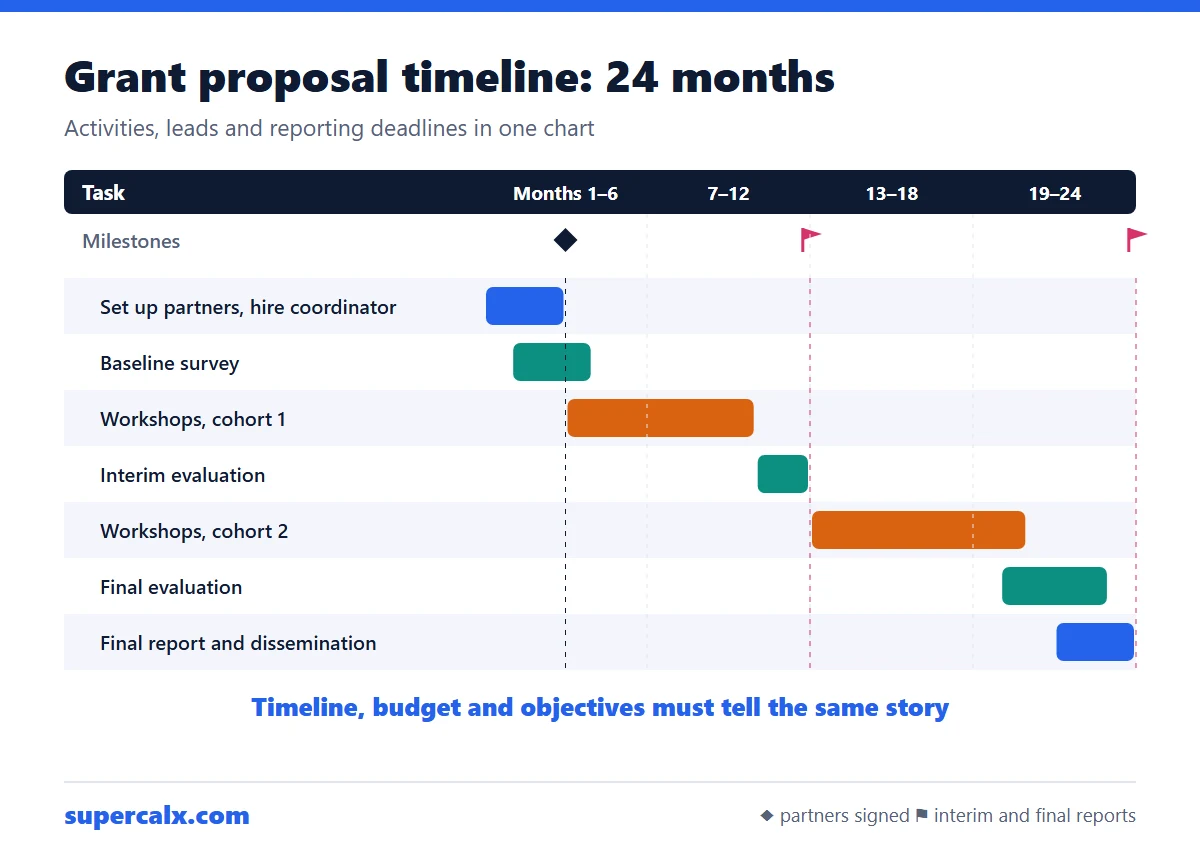 How to Write a Grant Proposal Timeline (With Example)
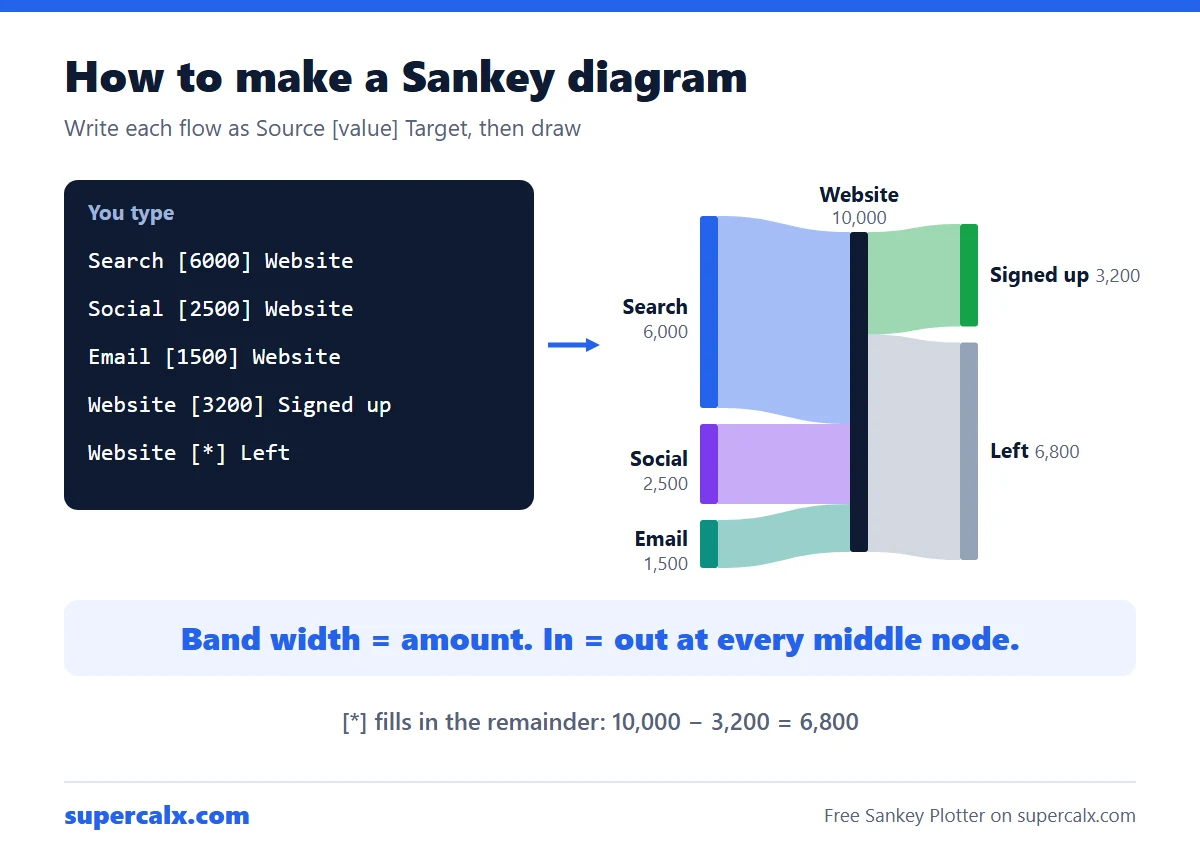 How to Make a Sankey Diagram (Free, No Excel Add-in)
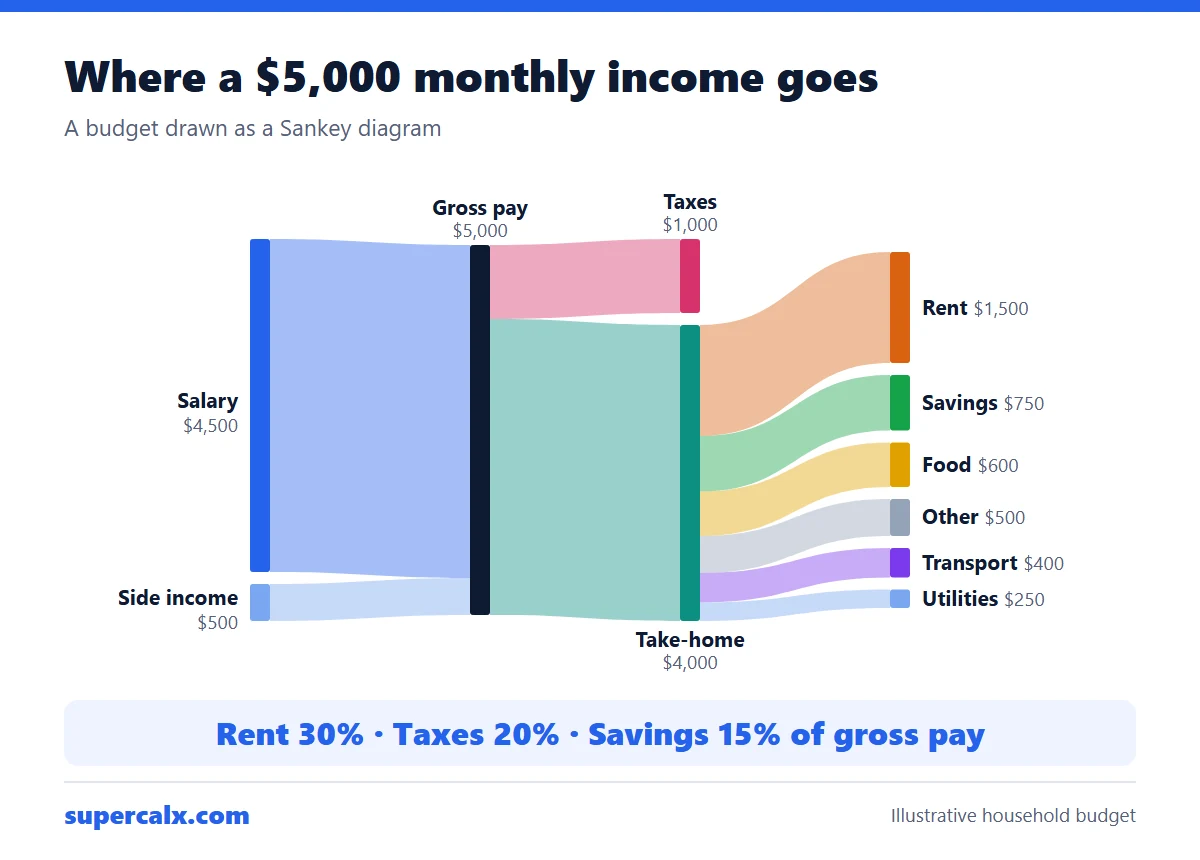 Sankey Diagram for a Budget: See Where Your Money Goes