How to Plot CSV Data Online (Free, No Code)
By Dr. Ahmed Mortuza Saleque · Updated · How we check our content
The short answer
To plot CSV data online, put column names in the first row and one record per row, then paste the text or drop the file into a browser plotting tool. Choose the column for the x-axis and one or more for the y-axis, pick a chart type, and export the image. The free SuperCalX Data Plotter does this without code or sign-up, and nothing is uploaded.
Open the Data Plotter →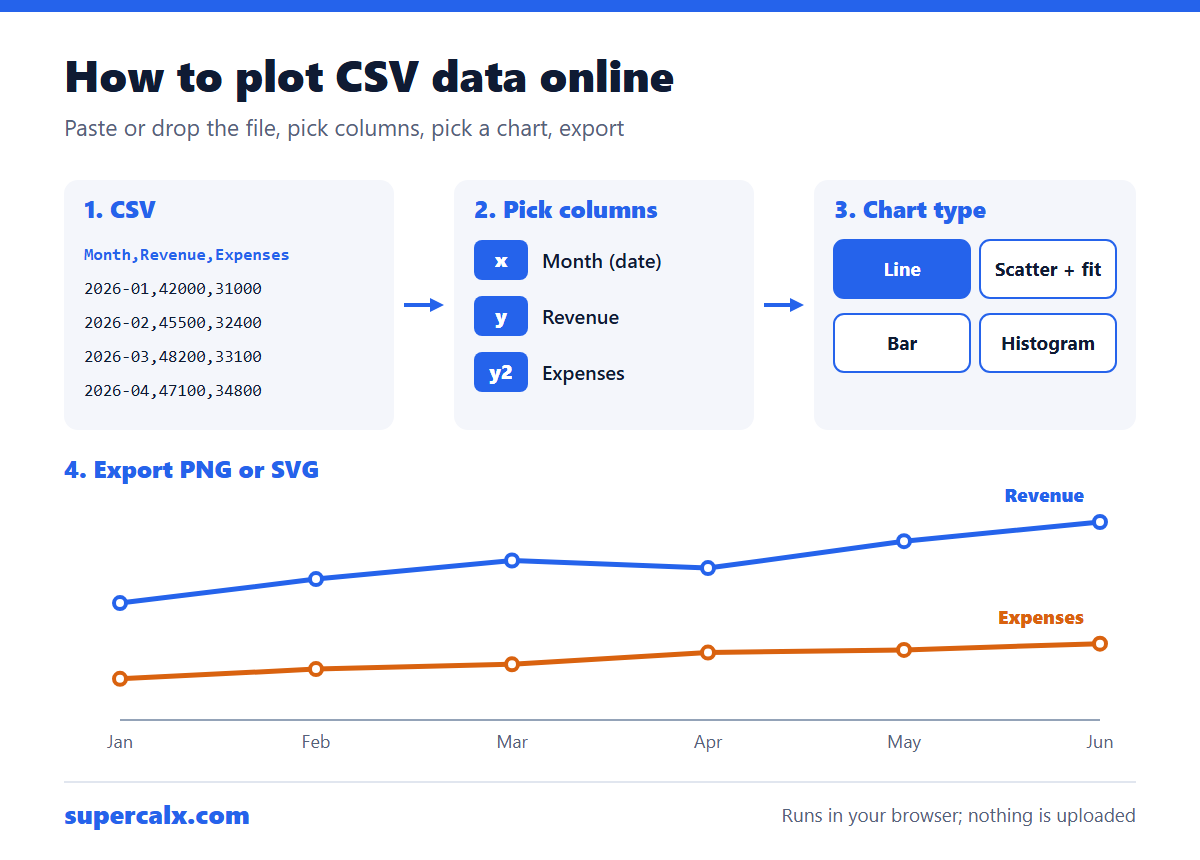
Format the CSV first
- First row: short column names, no merged cells.
- Numbers without currency signs or thousands separators (42000, not $42,000).
- Dates in one consistent format, ideally YYYY-MM-DD.
- Commas, tabs, semicolons or pipes all work as separators; the Data Plotter detects which one you used.
A tidy CSV: one header row, one row per observation, one value per cell.
| Month | Revenue | Expenses |
|---|---|---|
| 2026-01 | 42000 | 31000 |
| 2026-02 | 45500 | 32400 |
| 2026-03 | 48200 | 33100 |
| 2026-04 | 47100 | 34800 |
Plot it in four steps
- Open the Data Plotter and paste the CSV text, or drag a .csv, .tsv or .txt file onto the page. Sample datasets are there if you want to try it first.
- Check the preview. Each column is labelled numeric, categorical or date, and the first rows are shown so you can spot problems.
- Pick the x column and the y column (a second y-axis, a z column and a size column are available for some charts).
- Choose from 34 chart types, add a title and axis labels, then export PNG (2400 × 1600 px), SVG or the data as CSV.
Which chart for which columns?
| Your columns | Try |
|---|---|
| Date + one or more numbers | Line, area or time series |
| Number + number | Scatter, with a regression fit |
| Category + number | Bar or horizontal bar |
| One number column | Histogram or box plot |
| Several number columns | Correlation heatmap or scatter matrix |
The plotter suggests a chart type from your column types, and our guide on how to choose the right chart explains the reasoning.
Statistics come with the chart
Alongside the plot, the Data Plotter lists the mean, median, standard deviation, minimum, maximum, quartiles, skewness and kurtosis of every numeric column, plus a correlation matrix. It also flags outliers using the 1.5 × IQR rule. To check a single figure by hand, use the descriptive statistics calculator or the correlation coefficient calculator.
If the chart looks wrong
- A flat line at zero: a number column was read as text because of a stray symbol or space.
- Dates in the wrong order: mixed formats such as 03/04/2026 and 2026-04-03 in one column.
- Only some rows plotted: blank cells or a second header row partway down.
- Huge range hiding detail: turn on log axes or normalise the series.
Common questions
How do I turn a CSV into a graph without Excel?
Paste it into a browser tool such as the free SuperCalX Data Plotter, choose the columns and chart type, and download the image.
Is my data uploaded?
No. The Data Plotter reads the file inside your browser and does not send it to a server.
Can I plot more than one line?
Yes. Choose a second y column, or use a dual y-axis chart when the series have different units.
What file types can I use?
CSV, TSV and plain text files with comma, tab, semicolon or pipe separators, with headers in the first row.
Calculators for this article
More from the blog
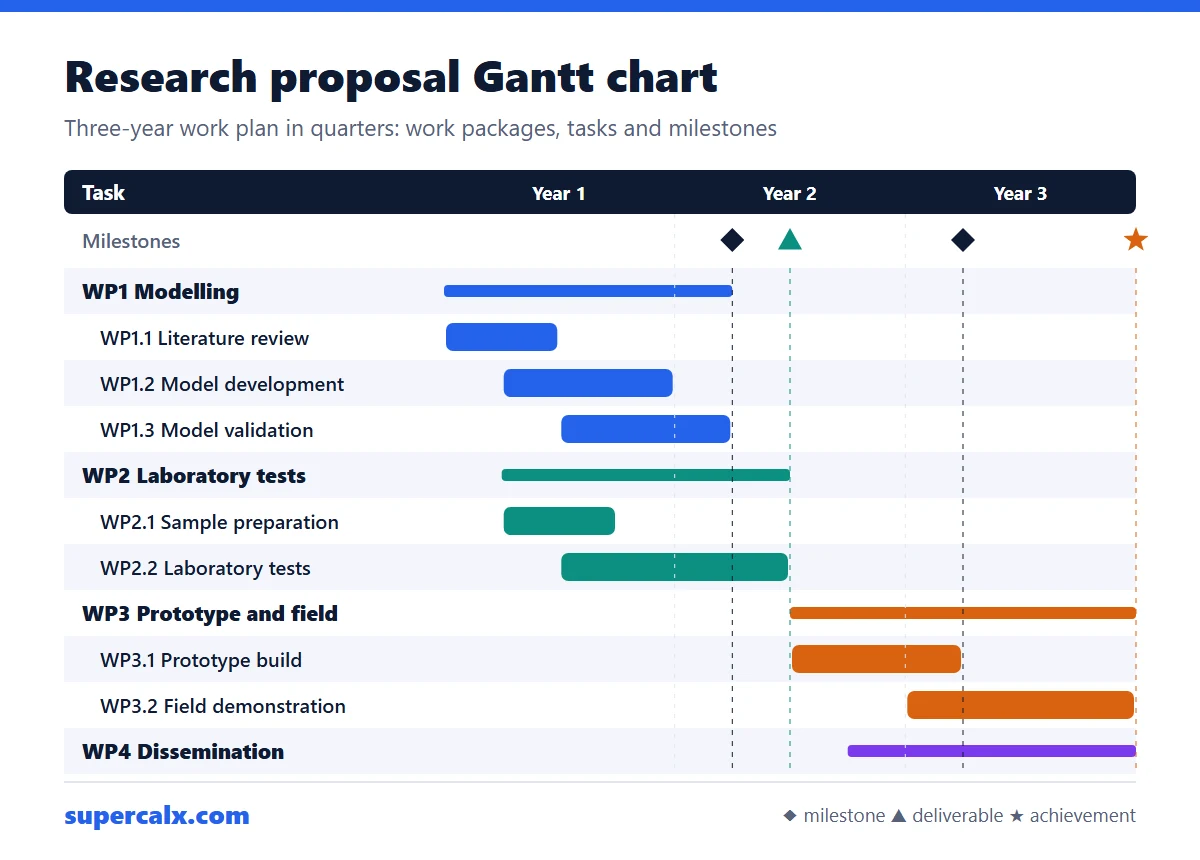 Gantt Chart for a Research Proposal: Example and Template
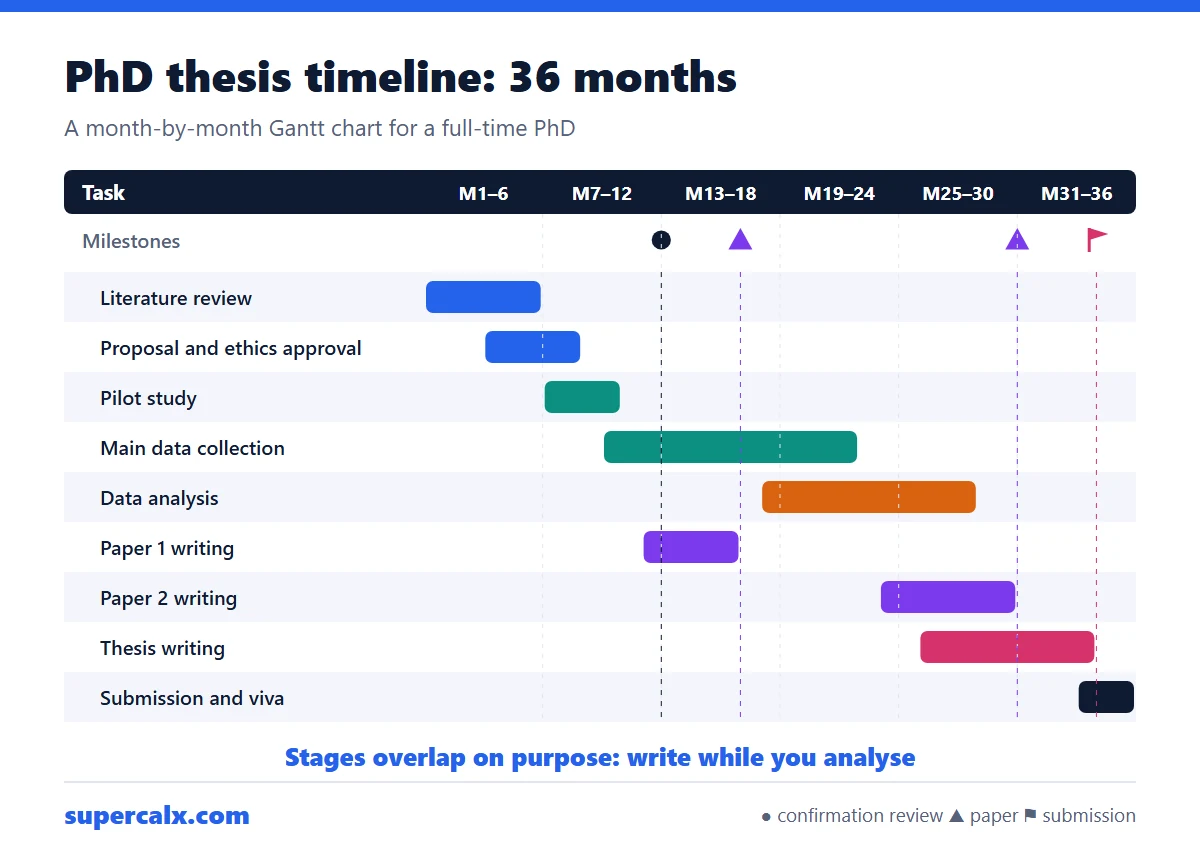 PhD and Thesis Gantt Chart: Timeline Example by Month
 Gantt Chart Milestones and Deliverables: How to Show Them
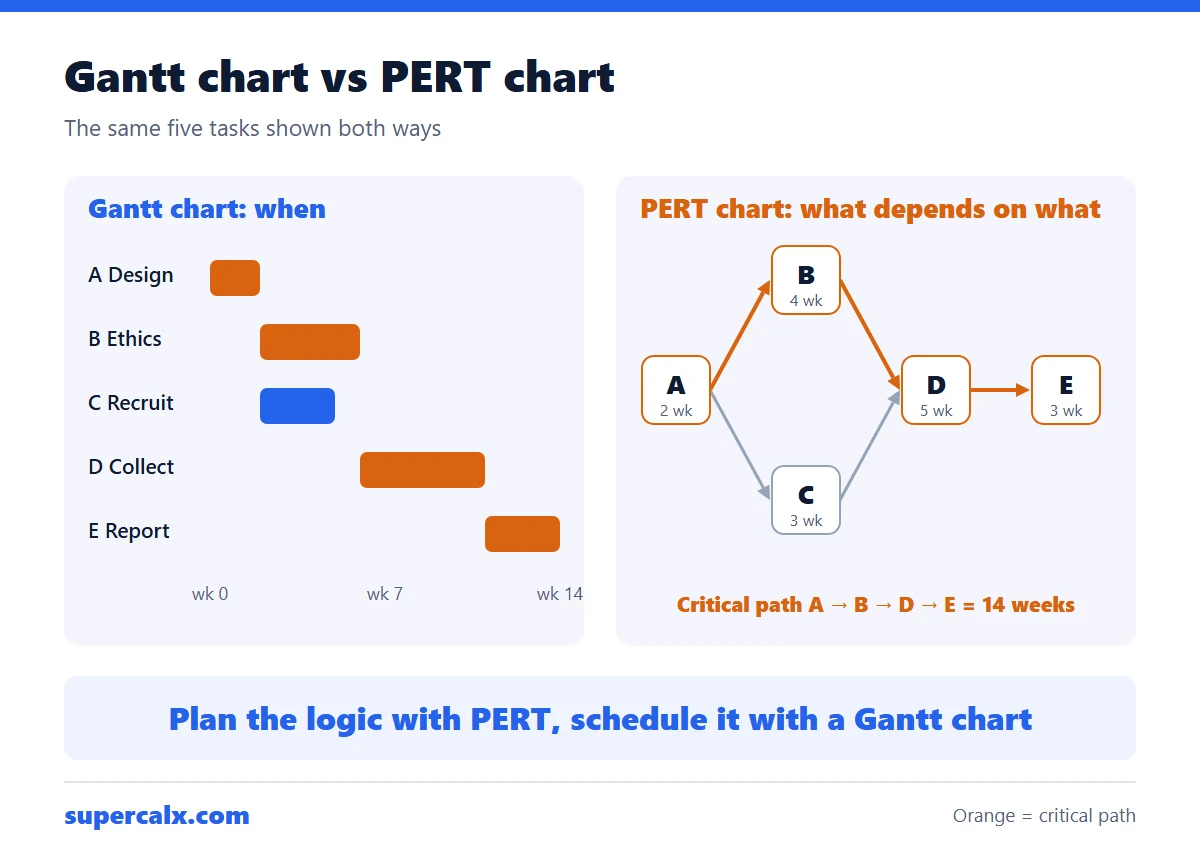 Gantt Chart vs PERT Chart vs Timeline: Which to Use
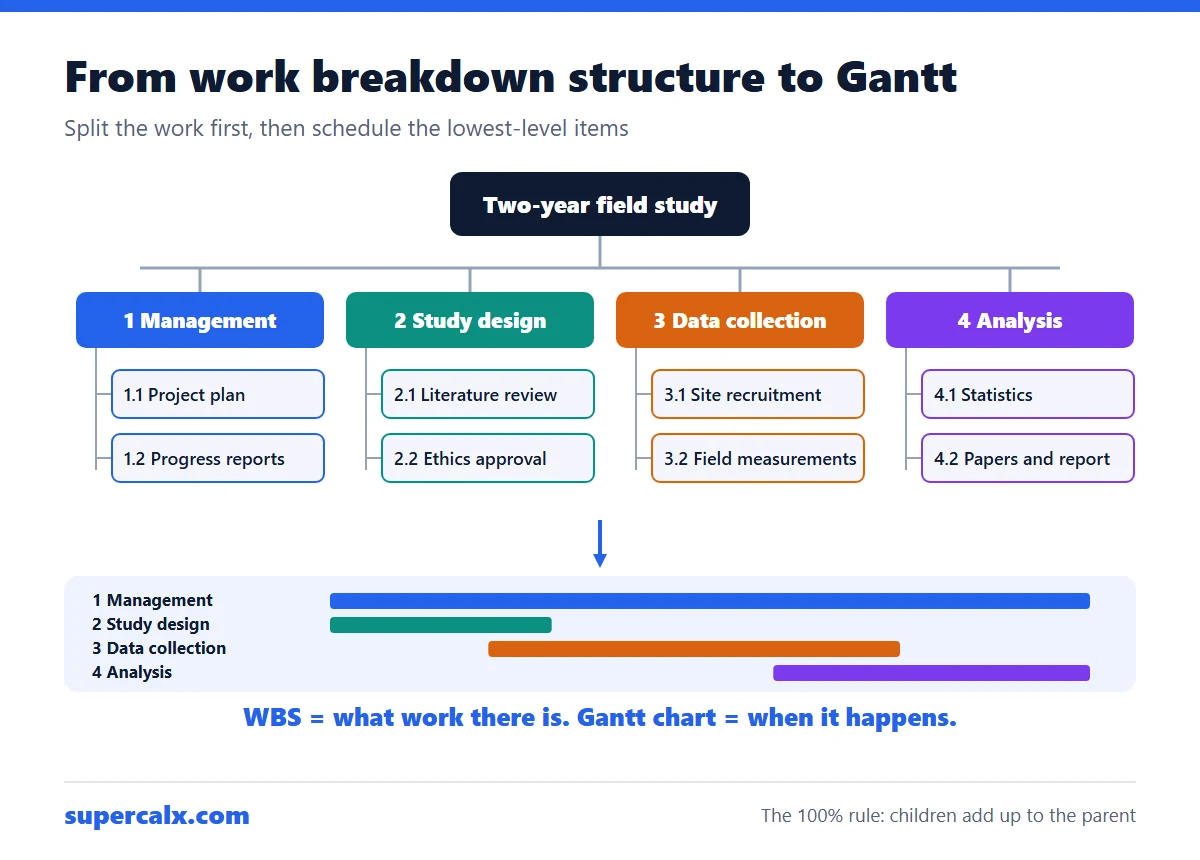 Work Breakdown Structure Example: From WBS to Gantt Chart
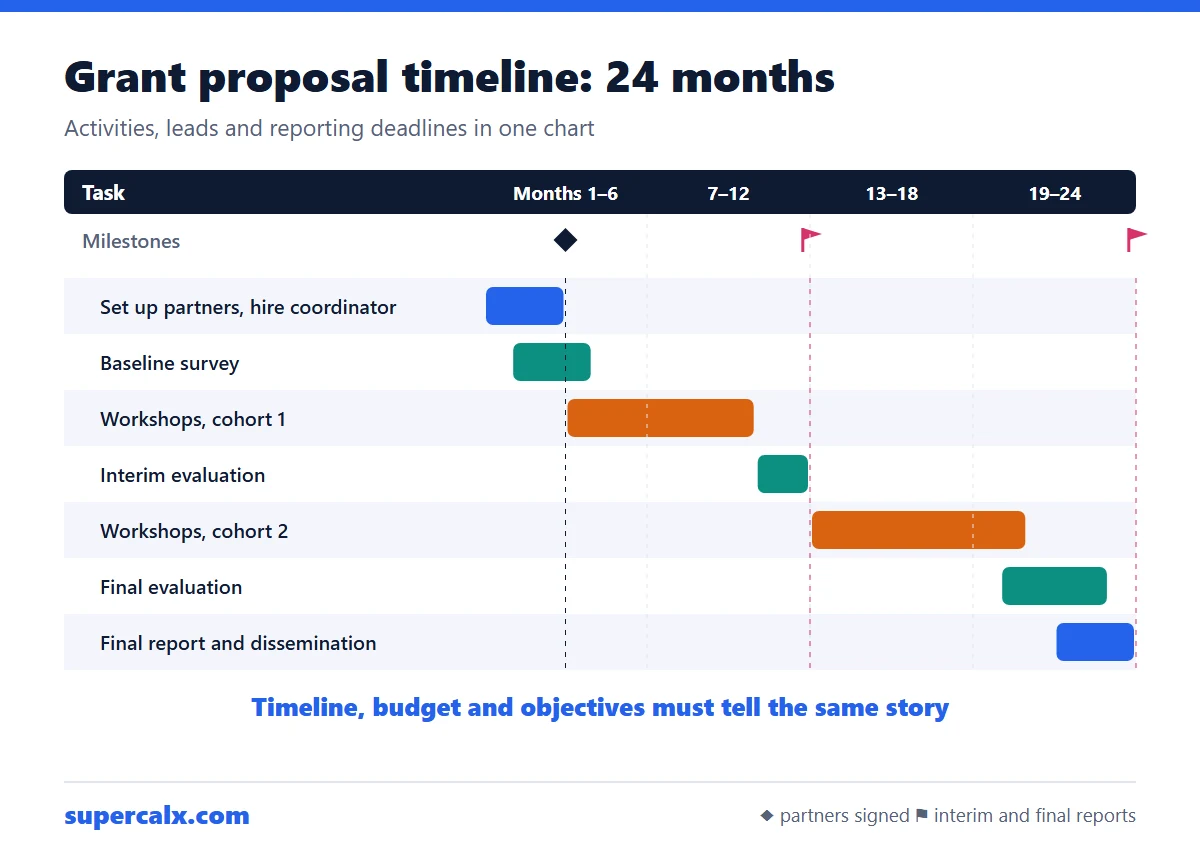 How to Write a Grant Proposal Timeline (With Example)
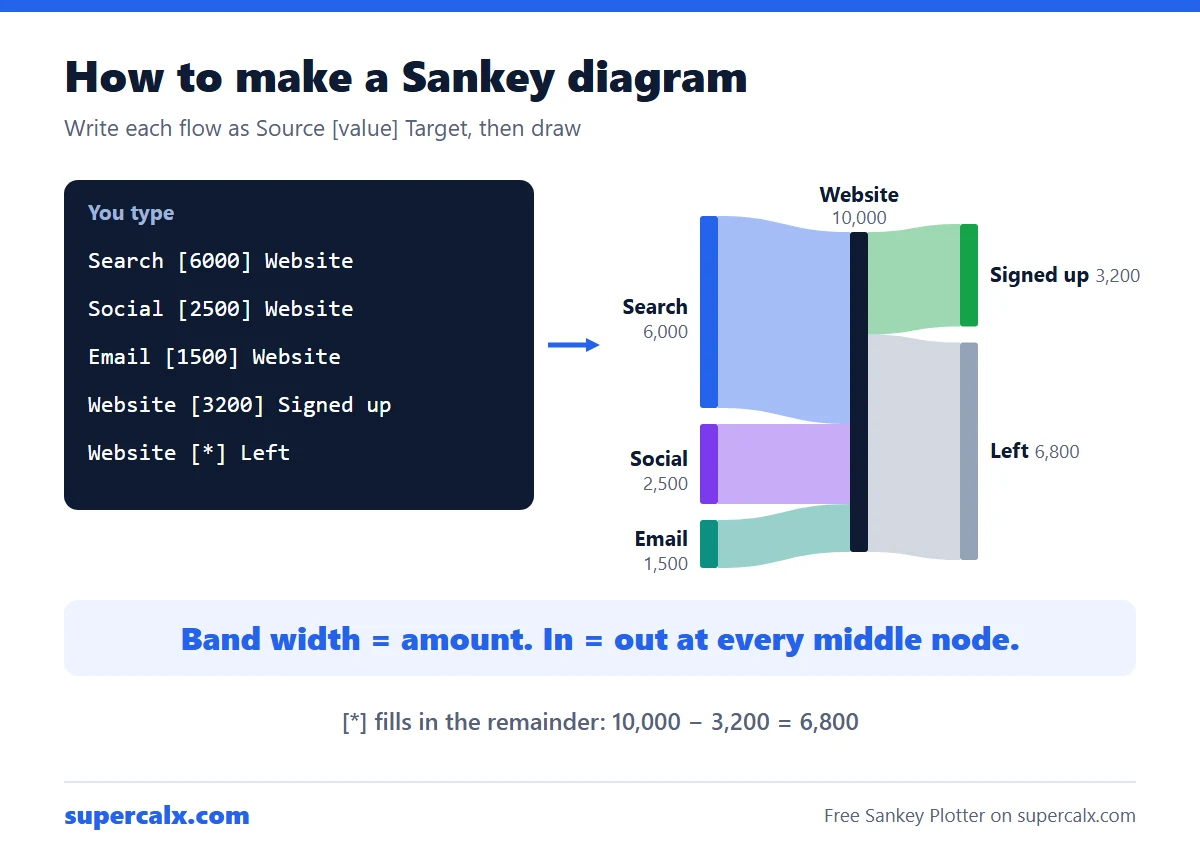 How to Make a Sankey Diagram (Free, No Excel Add-in)
 Sankey Diagram for a Budget: See Where Your Money Goes