Technology Readiness Levels (TRL 1 to 9) With Examples
By Dr. Ahmed Mortuza Saleque · Updated · How we check our content
The short answer
Technology readiness levels (TRLs) rate how mature a technology is on a scale of 1 to 9. TRL 1 means the basic science has been observed; TRL 3 is a lab proof of concept; TRL 6 is a prototype demonstrated in a realistic environment; TRL 9 is a system proven in real operation. The scale started at NASA and is now used by the EU, defence agencies and many funders.
Open the TRL Assessment →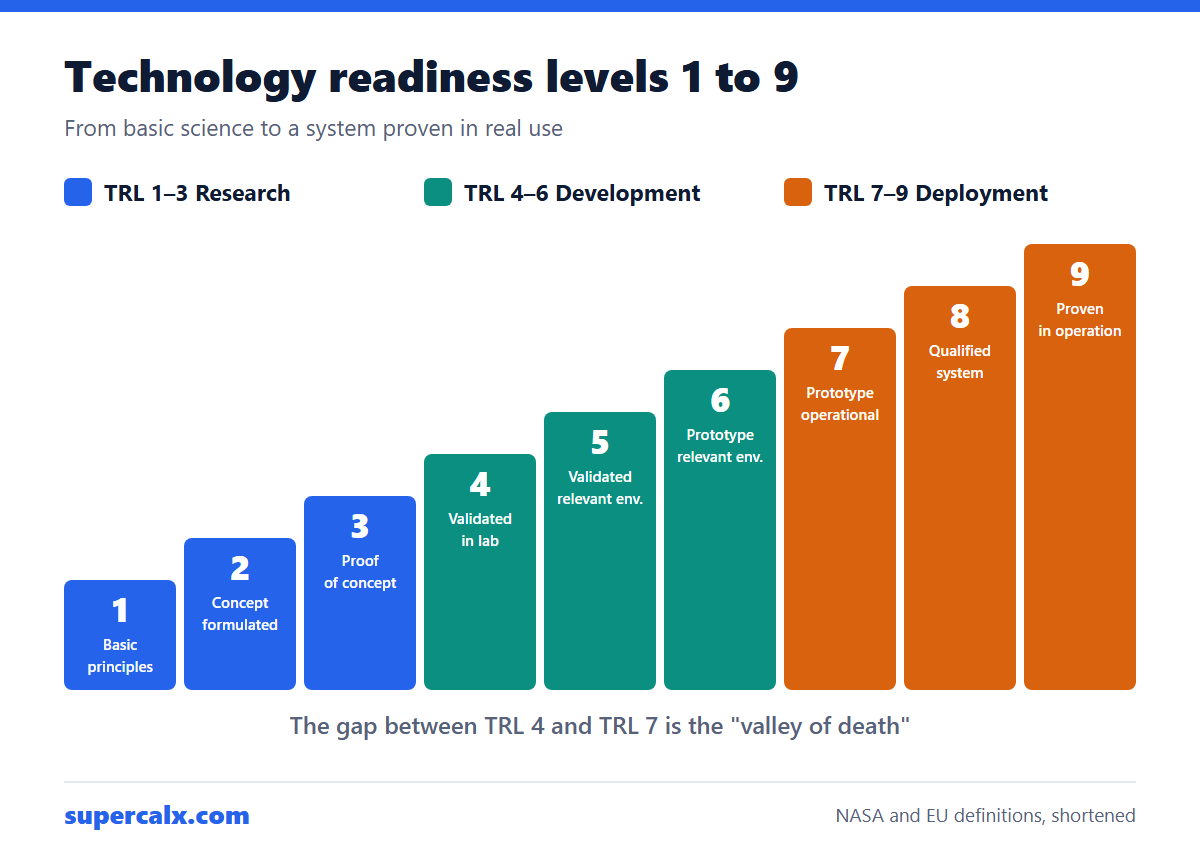
The nine levels
Wording follows the NASA and EU definitions, shortened.
| TRL | Definition | Typical evidence |
|---|---|---|
| 1 | Basic principles observed | Published research, theory |
| 2 | Technology concept formulated | Paper study, early analysis of an application |
| 3 | Experimental proof of concept | Lab results showing the key function works |
| 4 | Technology validated in the lab | Components working together on a bench |
| 5 | Technology validated in a relevant environment | Components tested under realistic conditions |
| 6 | Prototype demonstrated in a relevant environment | A representative system tested under realistic conditions |
| 7 | Prototype demonstrated in the operational environment | Near-final prototype working in the real setting |
| 8 | System complete and qualified | Final design passes tests and certification |
| 9 | System proven in operation | Used successfully in real service |
Example: a solid-state battery from TRL 1 to TRL 9
- TRL 1: a paper reports that a new ceramic conducts lithium ions well.
- TRL 2: the team proposes using it as the electrolyte in a car battery and models the performance.
- TRL 3: a single small coin cell in the lab charges and discharges.
- TRL 4: several cells and the electrode materials are tested together on the bench.
- TRL 5: cells are cycled at the temperatures and charging rates a car would see.
- TRL 6: a prototype battery module runs in a test rig that mimics a vehicle.
- TRL 7: a prototype pack is fitted to a test car and driven on real roads.
- TRL 8: the final pack passes safety and durability qualification.
- TRL 9: the pack is in production cars in customers' hands.
Three phases
| Levels | Phase | Who usually funds it |
|---|---|---|
| TRL 1–3 | Research | Research councils, universities |
| TRL 4–6 | Development | Applied research and innovation grants, venture capital |
| TRL 7–9 | Deployment | Industry, procurement, investors |
The gap between TRL 4 and TRL 7 is often called the valley of death, because research money stops and commercial money has not started. Grant proposals that cross it need a convincing plan, so pair your TRL claim with a Gantt chart showing how each level will be reached.
Rate your own technology
The free TRL Assessment asks yes-or-no questions for each level, up to the target level you set, across five themes from science and engineering to real-world testing. It reports which levels are fully met, recommends what to do for every "no", and exports a PDF report. Nothing is uploaded.
TRL measures technical maturity only. It says nothing about cost or market demand; check those separately, for example with the ROI calculator.
Common questions
How many TRL levels are there?
Nine, from TRL 1 (basic principles observed) to TRL 9 (system proven in operation).
Who created technology readiness levels?
NASA, starting in the 1970s. The nine-level scale was published in the 1990s and later adopted by the U.S. Department of Defense, the European Commission and others.
Do TRLs apply to software?
Yes. Agencies have software versions of the definitions: lab validation means testing modules together, a relevant environment means realistic data and loads, and operational means live use.
Is a higher TRL always better?
It means lower technical risk, not more value. Many funding calls target a specific range, such as TRL 2 to 4 for research grants.
Calculators for this article
Sources
More from the blog
 Gantt Chart for a Research Proposal: Example and Template
 PhD and Thesis Gantt Chart: Timeline Example by Month
 Gantt Chart Milestones and Deliverables: How to Show Them
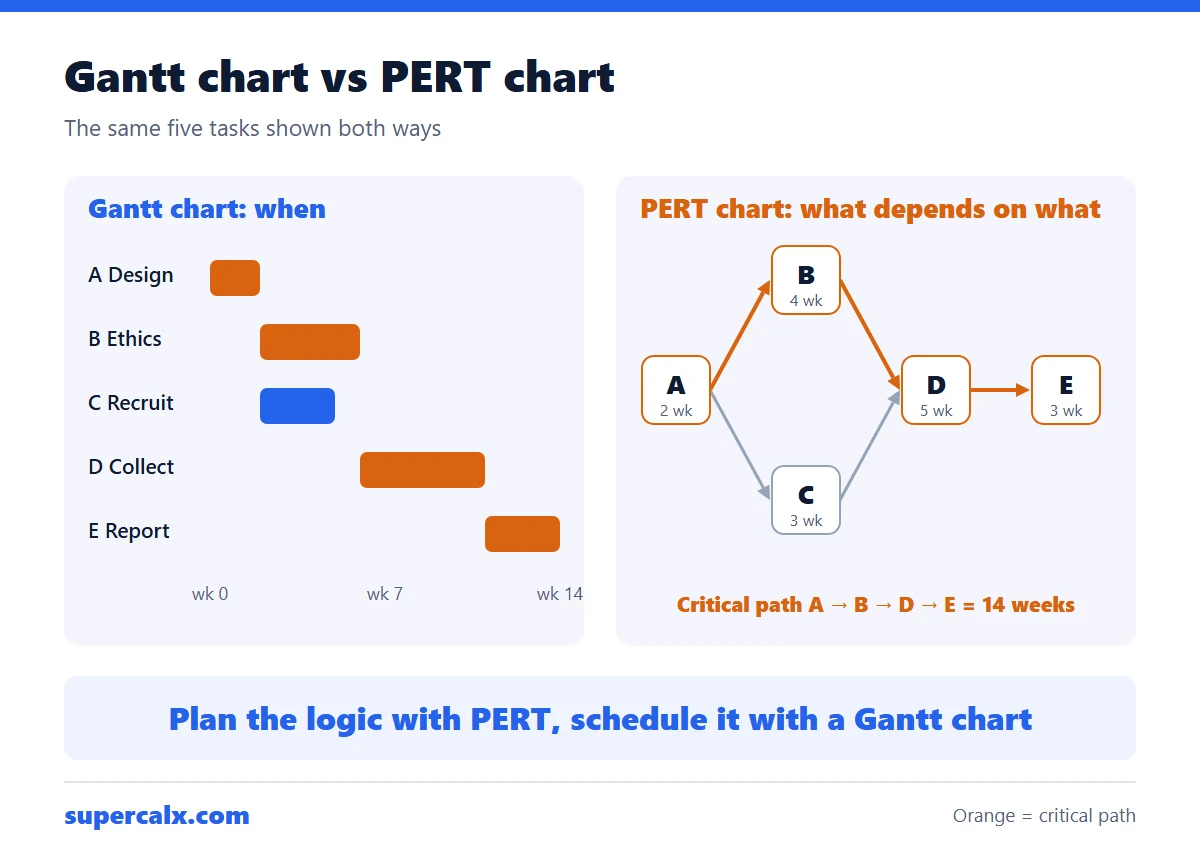 Gantt Chart vs PERT Chart vs Timeline: Which to Use
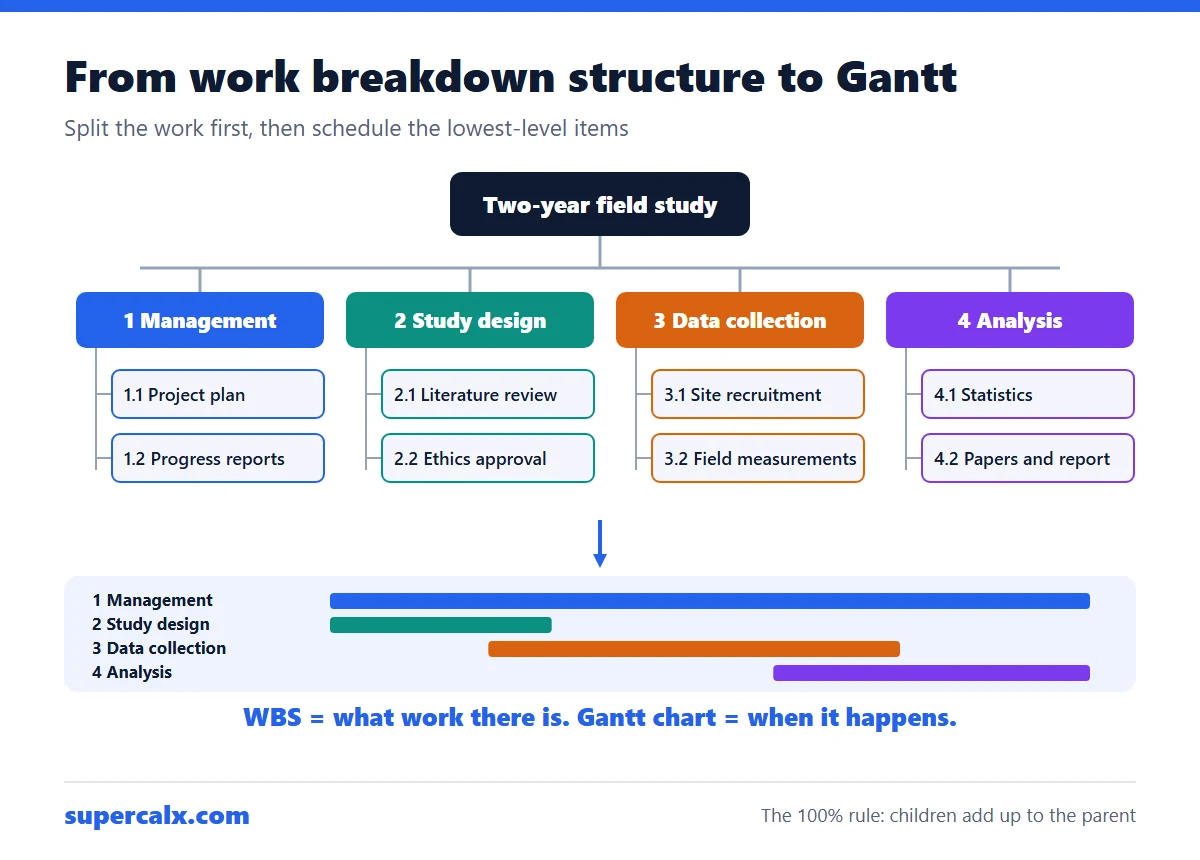 Work Breakdown Structure Example: From WBS to Gantt Chart
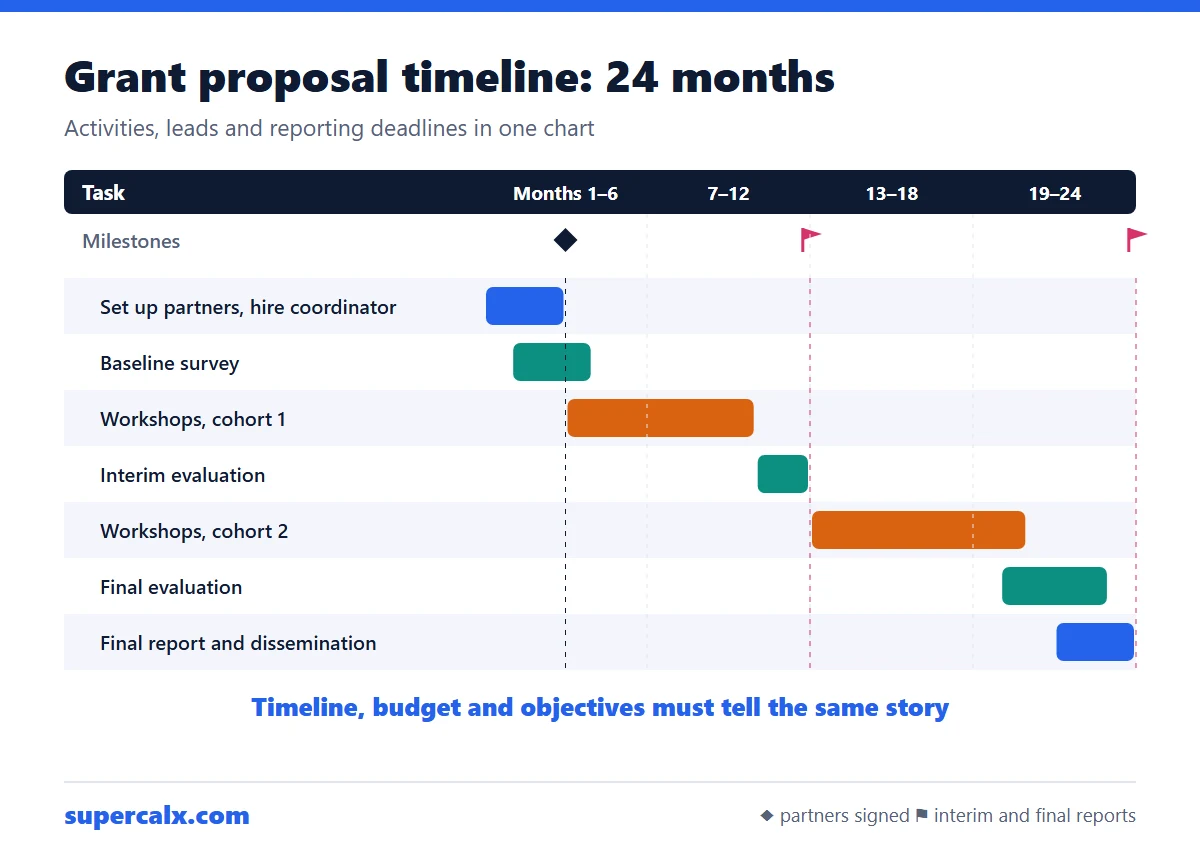 How to Write a Grant Proposal Timeline (With Example)
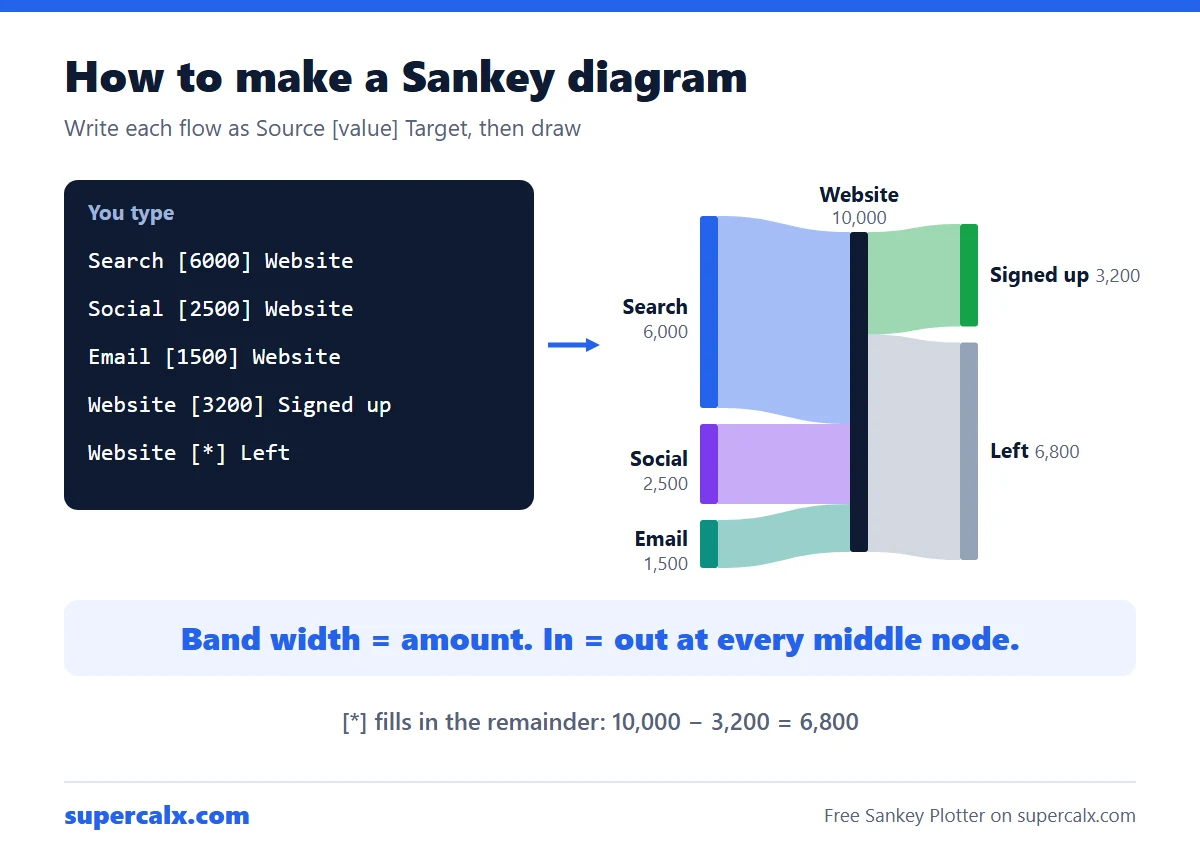 How to Make a Sankey Diagram (Free, No Excel Add-in)
 Sankey Diagram for a Budget: See Where Your Money Goes